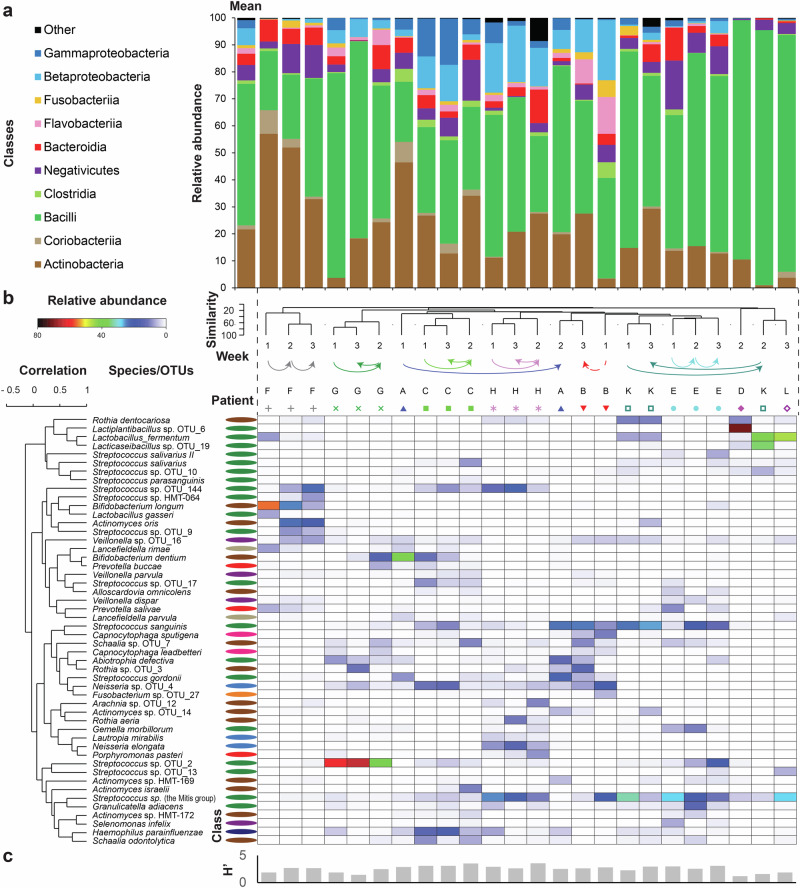
Fig. 4. Biofilm composition is individual-specific.
Taxonomic diversity of early biofilms as assessed with full 16S rRNA gene amplicons sequencing. a Relative abundance of reads grouped at the class level and plotted for each patient-time point combination as well as for average profile (first from left). Top ten abundant classes are shown, while the reads matching other classes were summed up and plotted together as “Other”. b Heatmap shows the relative abundance of selected species. Samples and species were clustered. For each sample, the time point and patient are depicted above the heatmap. Values for five diversity indices for each sample were plotted below heatmap. For each species the classification at the class level is indicated. c Values for Shannon diversity index were plotted below the heatmap.

