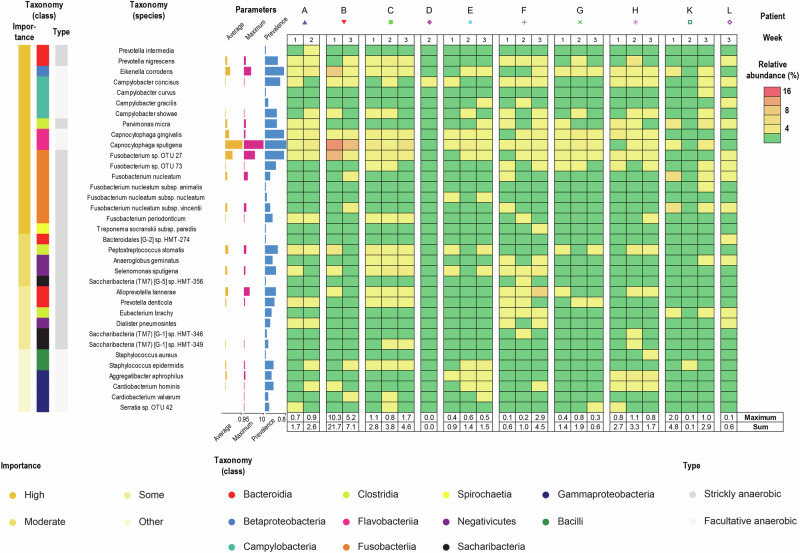
Fig. 6. Potentially pathogenic species identified in early implant-associated biofilms.
Potential pathogens identified in early implant-associated biofilm samples were sorted by taxonomy at the class level and importance. The following information is given (from left): importance, taxonomy at the class level, type of growth, species name, average relative abundance (yellow bars), maximum abundance (pink bars), and prevalence (blue bars), relative abundance plotted for every sample (heat map). Samples were sorted by time and by patient. Red indicates the highest abundance, yellow marks intermediate values and green zeros. Maximum values and sums are reported for each sample below heat map.

