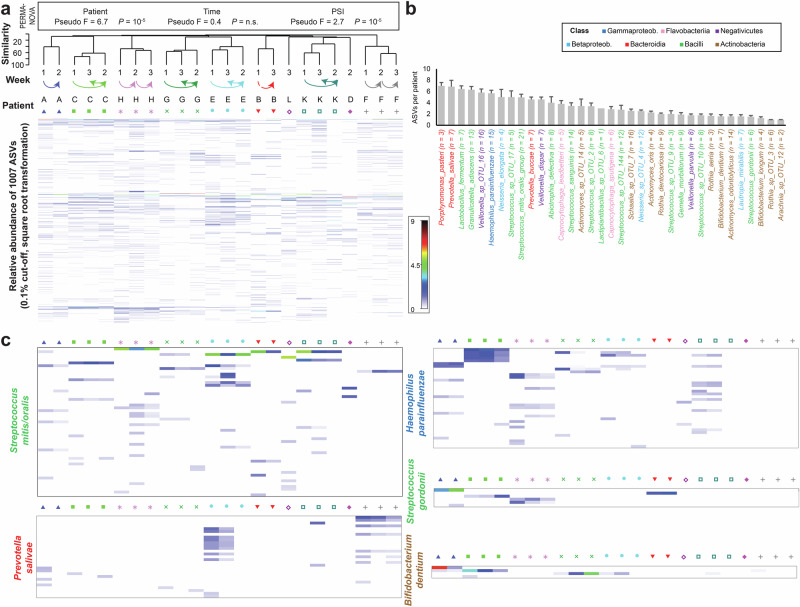
Fig. 8. Taxonomic diversity of early biofilms assessed using Amplicon Sequence Variants (ASVs).
a The heatmap illustrates the relative abundance of the most prevalent ASVs across all samples. Both samples and ASVs were hierarchically clustered. The time points and corresponding patient identifiers are indicated above the heatmap. b The bar graph displays the number of ASVs per patient for the 35 most abundant species, sorted by decreasing mean ASV count and colored by class. For each patient, only species with at least 50 reads were included, and the number of patients meeting this threshold is indicated in parentheses following the species name. c Heatmaps are shown for representative species with high ASV diversity (e.g., Streptococcus mitis/oralis, Prevotella salivae, Haemophilus parainfluenzae) and low ASV diversity (e.g., Bifidobacterium dentium, Streptococcus gordonii), following the same format as (a).

