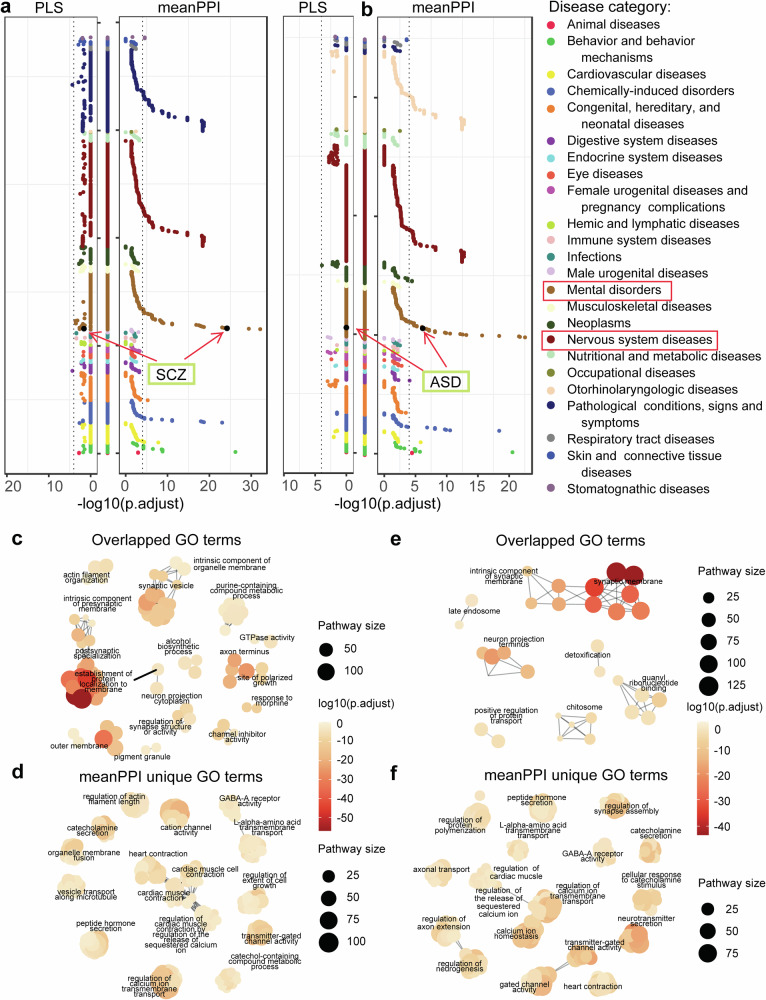
Fig. 5. Enrichment analysis of top-ranked genes related to SCZ and ASD traits.
a, b Disease enrichment results in DisGeNet diseases on top 1541 trait-related genes for SCZ (a) and ASD (b). The Y-axis lists disease with categories in alphabetical order. c–f Clusters of GO terms enrichment results on top 1541 genes for SCZ (overlapped terms in c, terms uniquely enriched by meanPPI method in d) and ASD (overlapped terms in (e), terms uniquely enriched by meanPPI method in (f). The size and color of the dots were proportional to the number of pathway genes and enrichment significance, respectively. The p-values were adjusted using Bonferroni correction. Clusters were generated from enriched GO terms by aPEAR (Advanced Pathway Enrichment Analysis Representation) package. It exploits the similarities between pathway gene sets and represents them as a network of interconnected clusters. Each cluster is assigned a meaningful name that highlights the main biological theme of the experiment.

