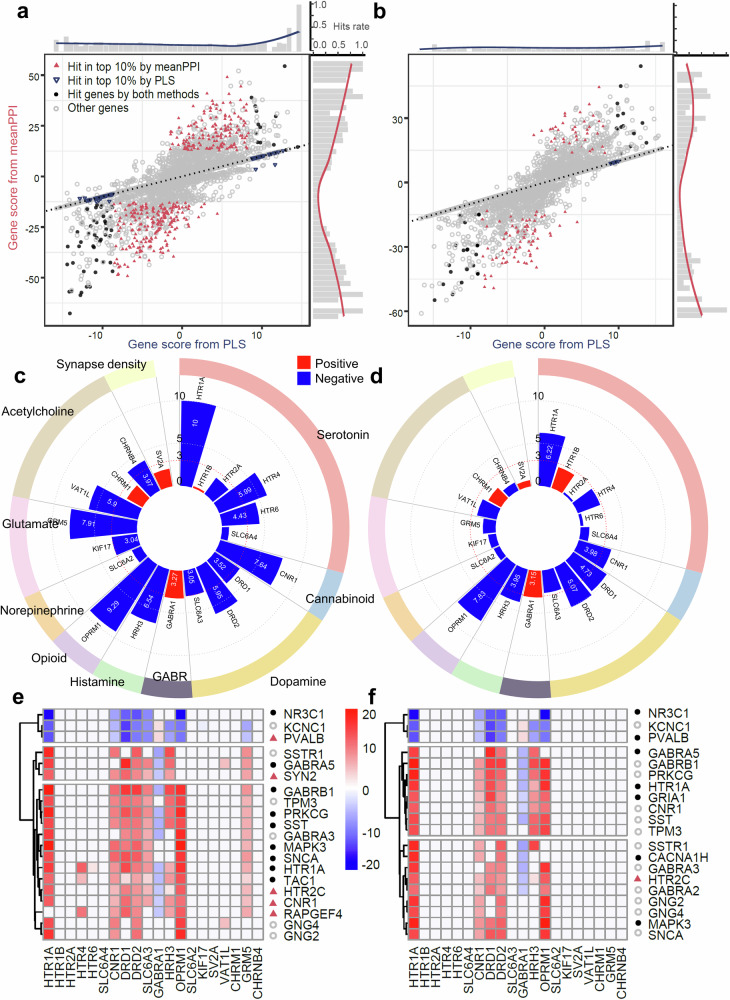
Fig. 6. Differential plot of genes by different fusion methods and neurotransmissions for SCZ and ASD.
a, b Gene scores from meanPPI method and PLS method. Black dots: genes overlapped among the genes from DisGeNet standard database, top 10% genes from meanPPI method, and top 10% genes from PLS method simultaneously. Blue triangles: genes overlapped between the genes from DisGeNet database and 10% genes from PLS method. Magenta triangles: genes overlapped between the genes from DisGeNet database and 10% genes from meanPPI methods. The bar chart at the edge shows the hit rates of these disease related genes. c, d Associations measured by PLS Z-score between all PET maps of various neurotransmission process and disease trait (c: SCZ; d: ASD). e, f Top 20 candidate genes identified by meanPPI method, and the gene-PET effects measured by PLS Z- score for SCZ (e) and ASD (f) disease trait. Point shapes of genes in (e–f) have the same meanings as in (a, b).

