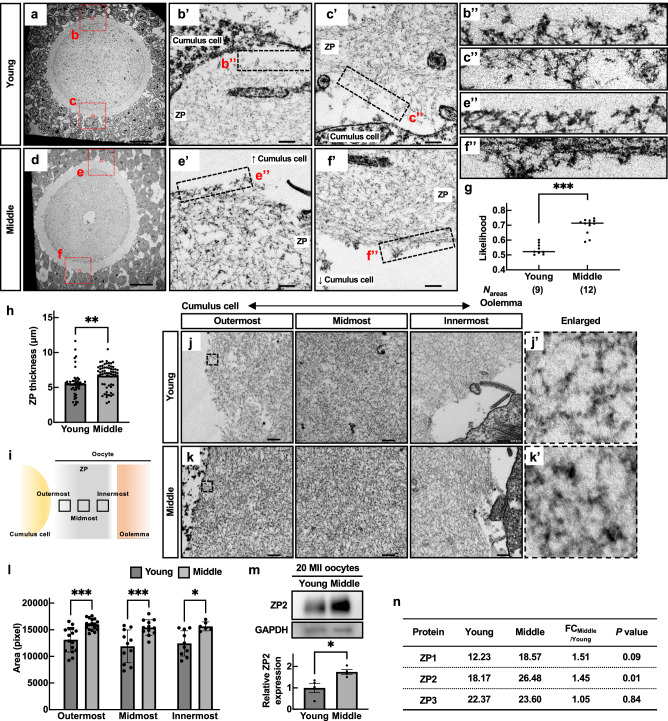
Fig. 5. Aberrant accumulation of ZP filaments occurred in middle-aged mice.
a–f TEM picture s of the antral follicles. The regions surrounded by red dotted lines are highlighted in (b, c, e, f) in Supplementary Fig. 6a. Enlarged images of b’, c’, e’, and f’ were also shown in b”, c”, e”, and f”. Scale bars = 200 nm in (a, d), and 20 nm in b’, c’, e’, and f’. g Verification of surface roughness in the ZP. The value of likelihood was obtained by a fractal dimension analysis. h The ZP thickness. **p < 0.01; Tukey-Kramer test. i Schematic position of outermost, midmost, and innermost in the ZP. j, k TEM pictures of the ZP filaments composing the outermost, middle, and innermost areas. A double arrow explains a position between a cumulus cell side to an oolemma side. The regions surrounded by dotted lines are highlighted in j’ and k’. l Areas of ZP filaments in outermost, midmost, and innermost. *p < 0.05, ***p < 0.001; Tukey-Kramer test. m Western blot of ZP2 in 20 MII oocytes. GAPDH was used as a loading control. Statistical analysis of ZP2. Four independent experiments were tested. *p < 0.05 (unpaired Student’s t-test). n MS analysis of the ZP. Average MS score was obtained from three independent experiments (Nmice = 3). p; unpaired Student’s t-test. Data are mean ± SEM.

