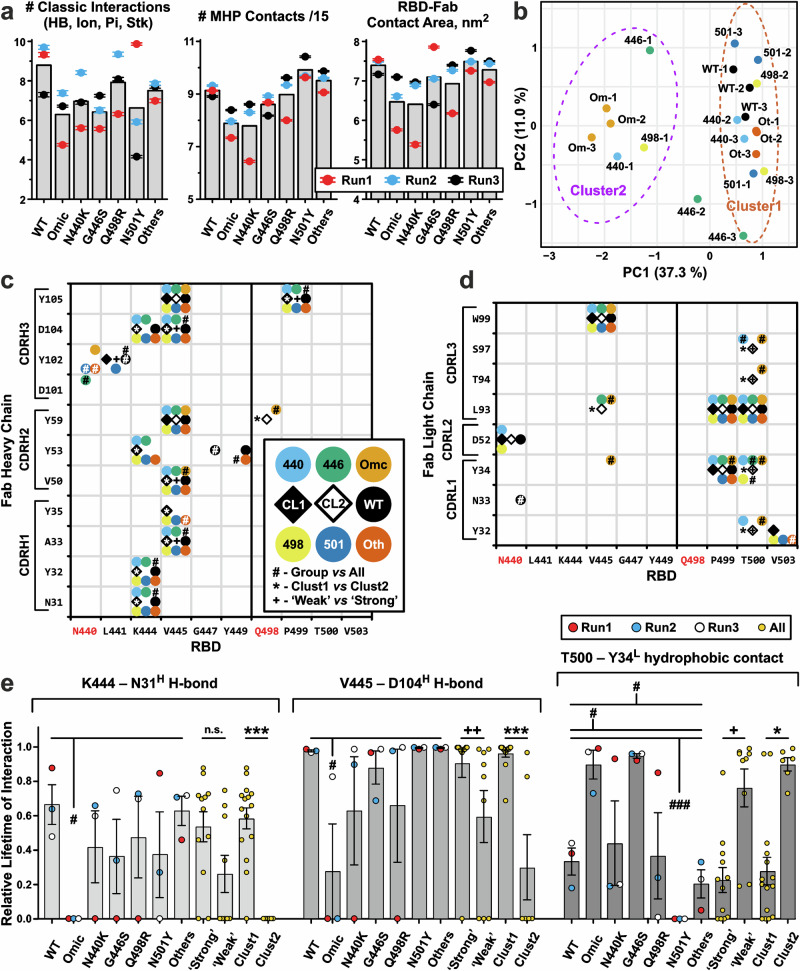
Fig. 7. Intermolecular interactions in the 500–1000 ns parts of the RBD/REGN10987-Fab MD trajectories.
a Average characteristics of MD trajectories (three replicas for each RBD variant, Run1 to Run3). The total number of ‘classic’’ RBD-Fab interactions (ionic, H-bond, π-cation, and stacking) and molecular hydrophobicity potential (MHP) contacts divided by 15, as well as the RBD-Fab contact area in the complex are shown. The scaling factor ‘15’’ was used to approximately equalize the number of ‘classic’’ and MHP contacts. MHP contacts include hydrophobic-hydrophobic and polar-polar intermolecular interactions. Data are mean ± S.E.M. (n = 500, 1 point per 1 ns of MD simulation). Bars denote means calculated over the three replicas. b Clustering of the MD replicas by K-means algorithm. Ellipses on a PCA plot show the 95% confidence interval of the clusters. Each MD trajectory was represented by a vector containing the lifetimes of all observed RBD-FAB contacts (Supplementary Data 1-9). Maps of the intermolecular contacts of the heavy (c) and light (d) Fab chains with RBDs. Interactions with an average (over the three replicas) lifetime ≥35% are shown as circles of different colors for different RBD variants. The 35% threshold was chosen to exclude situations where an interaction is presented in only one replica. Open and filled diamonds indicate interactions observed in 35% of trajectories from Cluster2 (trajectories Omic-1, Omic-2, Omic-3, 440-1, 446-1, and 498-1) and Cluster1 (all others trajectories), respectively. e Lifetimes (mean ± S.E.M., n = 3 independent MD replicas) of some intermolecular interactions normalized to the MD replica length. (c–e) #, *, + (p < 0.05), ++ (p < 0.01), and ###, ***(p < 0.001) indicate significant difference in the interaction lifetimes in the following comparisons: (#) the replicas of a particular RBD variant vs all other replicas (cumulatively); (*) Cluster1 vs Cluster2 replicas; and (+) MD trajectories of ‘Weak’’ vs ‘Strong’’ binders, respectively, according to the Mann–Whitney test. No correction for multiple comparisons was used. Group of ‘Strong’’ binders includes WT, ‘Others’’, Q498R, and N501Y RBDs. Group of ‘Weak’’ binders includes Omicron, N440K, and G446S RBDs. In addition, it was required that the difference in average interaction lifetime between the compared groups was >25%.

