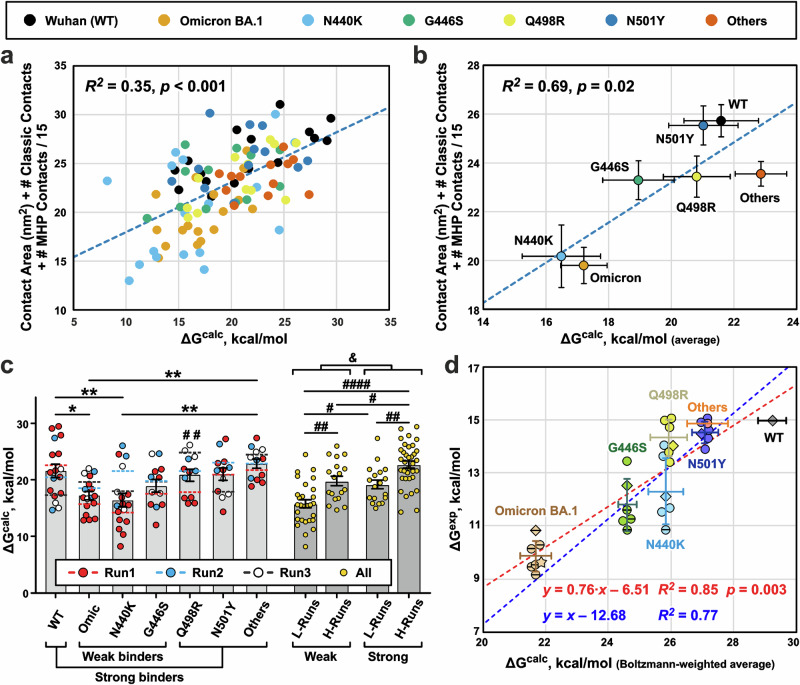
Fig. 8. Calculation of free energy changes (ΔGcalc) upon dissociation of RBD/REGN10987-Fab complexes.
a ΔGcalc values calculated for the different RBD variants using different initial conformations (n = 99, in total) positively correlate with the structural characteristics of these conformations (Supplementary Data 1-11 and 1-12). b Same as (a), but averaged for each RBD variant (arithmetic mean ± S.E.M., n = 17 for Wuhan, Omicron, N440K RBD variants, and n = 12 for other RBD variants). c Calculated ΔGcalc values vs RBD variant/MD replica (Run1 to Run3). Bars are the averages (arithmetic mean ± S.E.M., the n numbers are the same as in (b)) for the RBD variants, and dashed lines are means for the replicas. *(p < 0.05) and **(p < 0.01) indicate significant differences between the RBD variants according to one-way ANOVA/Tukey test. #(p < 0.05), ##(p < 0.01), and ####(p < 0.0001) indicate significant differences between the four groups of MD replicas according to two-way ANOVA/Tukey test. Groups: Weak+L-Runs (Omic-1, 440-1, and 446-1), Weak+H-Runs (Omic-2, Omic-3, 440-2, 440-3, 446-2, and 446-3), Strong+L-Runs (WT-3, 498-1, 501-3, and Oth-1), Strong+H-Runs (WT-1, WT-2, 498-2, 498-3, 501-1, 501-2, Oth-2, and Oth-3). &(p = 1.7 × 10⁻⁶, n = 99 independent ΔG calculations, two-tailed t-test) indicates significant difference between ‘Weak’’ and ‘Strong’’ binders. d Boltzmann-weighted averaged ΔGcalc values (abscissa, Boltzmann-weighted mean ± Boltzmann-weighted SD, N = 12–17, Supplementary Data 1-13) for different RBD variants show a strong positive correlation with the averaged experimental ΔGexp values (ordinate, arithmetic mean ± SD, N = 6, Supplementary Data 1-14). ΔGexp values recalculated from the MST data (Fig. 5) are shown as diamonds. ΔGexp values recalculated from EC50 and Kd values reported in the literature8,35,38,39,57 are shown as circles. Datapoints for the N440K, G446S, and Omicron BA.1 variants corresponding to lower estimates of EC50 or Kd values8,35,38,39,57 are shown by horizontally crossed circles and diamond. ΔGexp value for the Omicron BA.1 variant recalculated from the measured EC50 value52 is shown as a star. Only one experimental data point is present for the ‘Others’’ RBD variant. The different ΔGexp data sets were aligned assuming that the dissociation free energy for WT RBD is 15 kcal/mol. Therefore, only one data point is shown for the WT variant. Blue and red dashed lines represent regressions to linear models with unitary and variable slope, respectively.

