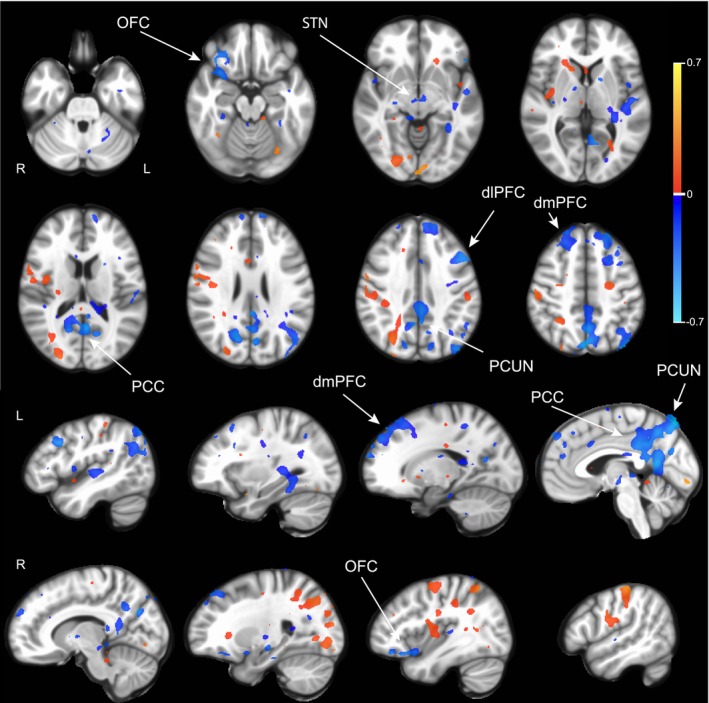
FIGURE 2.

BOLD response differences between therapeutic and non‐therapeutic DBS. Group comparison using linear mixed effects model of BOLD response between DBS On and Off in therapeutic (n = 6 runs, 3 subjects) versus nontherapeutic (n = 17 runs, 5 subjects) DBS configurations. Activations are in red and suppressions in blue. Color bar indicates percentage change in BOLD signal. dmPFC, Dorsomedial prefrontal cortex; OFC, Orbitofrontal cortex; PCUN, Precuneus; PCC, Posterior cingulate cortex; STN, Subthalamic nucleus. p < 0.05; LME.
