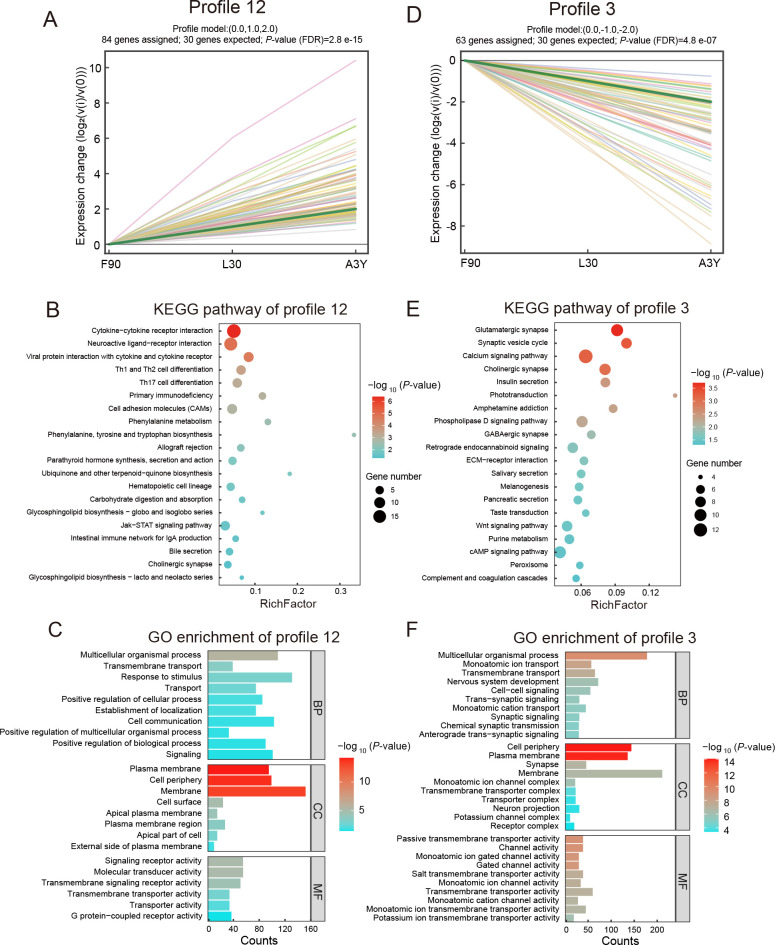
Figure 3.
Short time-series expression miner (STEM) clustering analysis of differentially expressed (DE) lncRNAs
A: Continuously up-regulated profile 12 ( P<0.05), where green line represents overall trend, and each colored line represents individual DE lncRNAs. B: KEGG analysis of genes potentially regulated by DE lncRNAs in profile 12. C: GO analysis of genes potentially regulated by DE lncRNAs in profile 12. D: Continuously down-regulated profile 3 ( P<0.05), where green line represents overall trend, and each colored line represents individual DE lncRNAs. E: KEGG analysis of genes potentially regulated by DE lncRNAs in profile 3. F: GO analysis of genes potentially regulated by DE lncRNAs in profile 3. Enriched terms and pathways are shown according to P-values.

