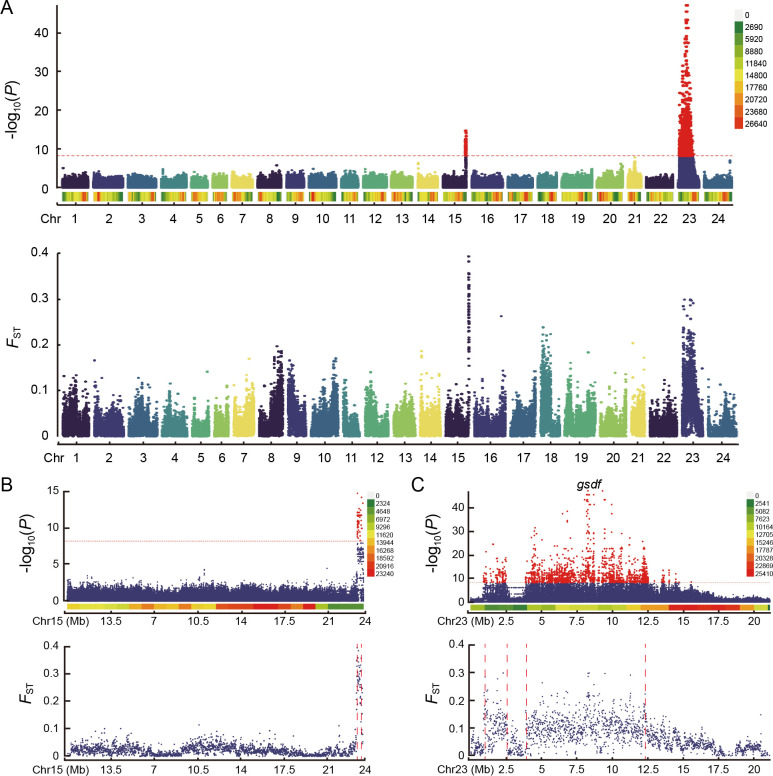
Figure 1.
Manhattan plot for GWAS and F ST results associated with sex traits
A–C: First track shows sex-associated SNPs identified by GWAS, second track shows weighted F ST values between males and females in 10 kb windows in all chromosomes, Chr15, and Chr23, respectively. Legend on right indicates SNP density, red dashed line marks candidate region boundary.

