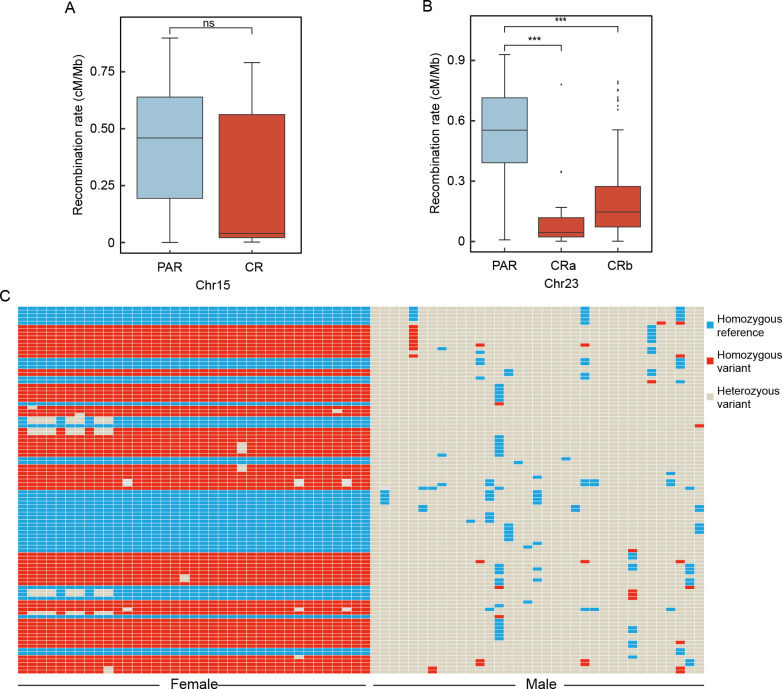
Figure 2.
Recombination landscapes and genotypes
A, B: Recombination rates between candidate regions (CR) (red) and pseudoautosomal regions (PAR) (blue) in Chr15 and Chr23. CRa refers to first candidate region in Chr23; CRb refers to second candidate region in Chr23. ns: Not significant; ***: P<0.001. C: Genotypes of top 100 strongest sex-associated SNPs based on GWAS analysis of Chr23.

