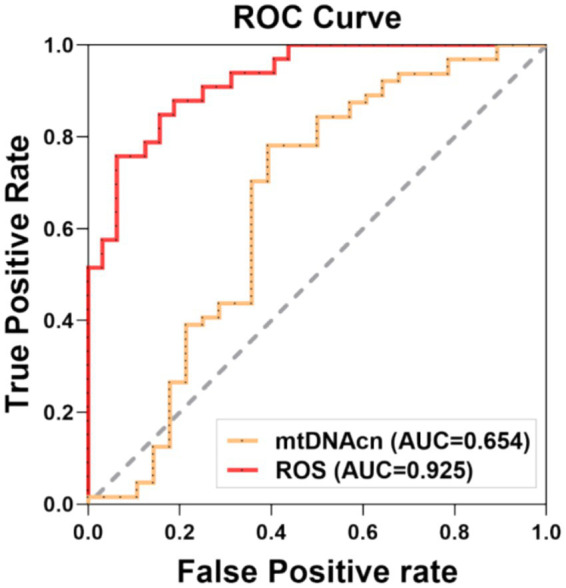
Figure 4.

Receiver operating characteristic (ROC) curve for the prediction model. The sensitivity analysis was conducted by ROC curve, which was assessed the capacity of mtDNAcn and ROS to predictive CF, respectively. Statistical significance was defined at p < 0.05. AUC: area under the curve, mtDNAcn: mitochondrial DNA copy number, ROS: reactive oxygen species.
