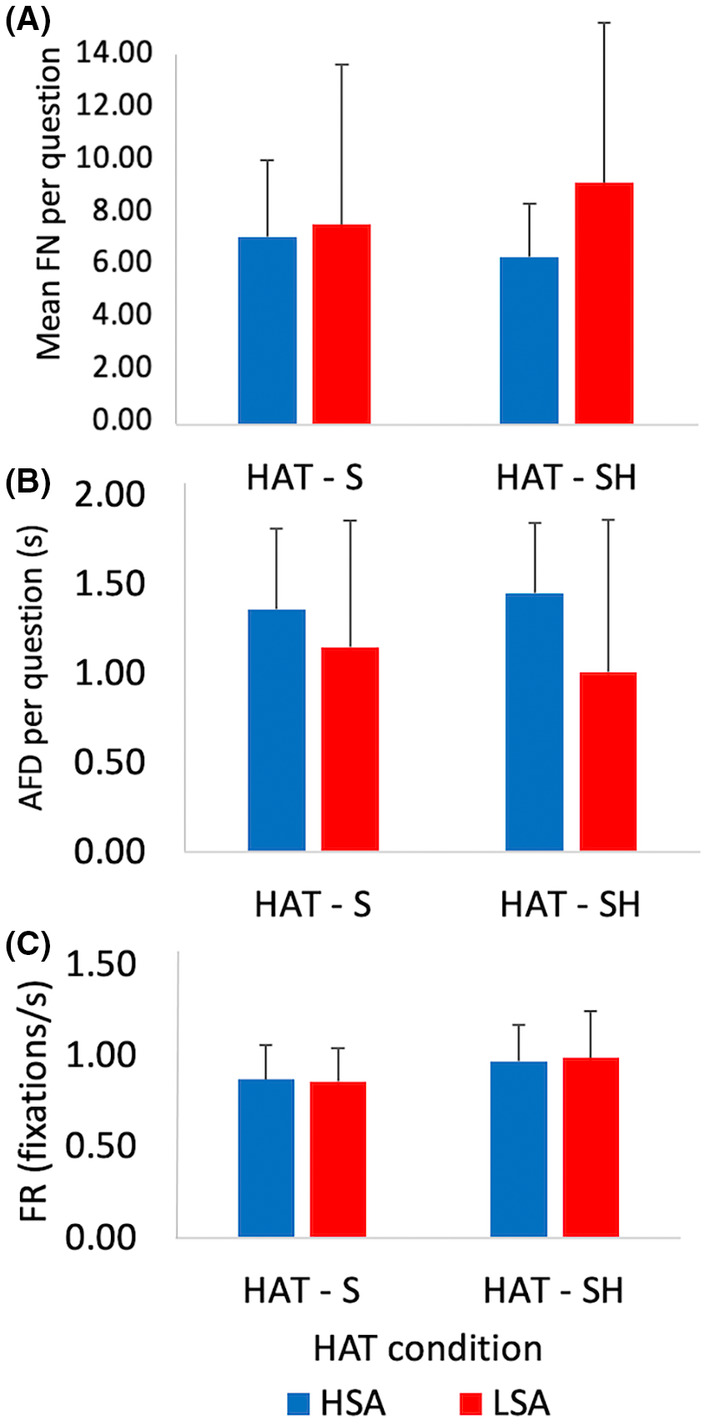
FIGURE 3.

Participant's visual attention during the HAT represented by gaze fixations during sighted S and SH conditions in HSA and LSA individuals (n = 20). Data are represented as per question means ±1SD. Top Panel A: Average fixation number (FN) indicating how often participant's eyes remain stationary per question. Middle Panel B: Average fixation duration (AFD) indicates how long the eyes remained stationary during each question. Bottom Panel C: Average fixation rate (FR) indicates how often individuals moved their eyes from location to location within their field of view. No significant differences between groups or conditions were found. HAT, haptic abilities test; HSA, high spatial abilities, LSA, low spatial abilities; n, frequency; s, seconds; S, sighted; SD, standard deviation; SH, sighted haptic.
