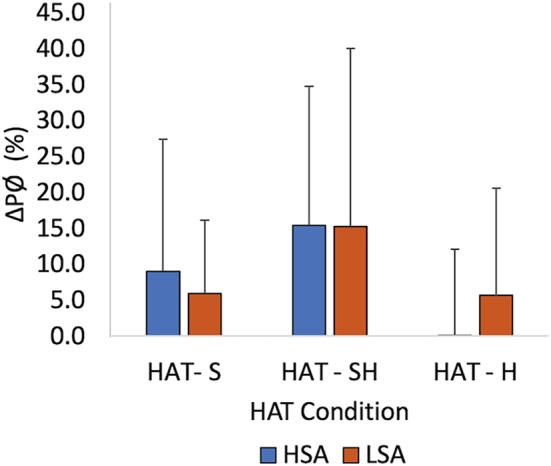
FIGURE 5.

Mean percent change in pupillary diameter (∆PØ) from participants' baseline diameter in the S, SH, and H sensory conditions of the HAT for HSA and LSA groups (n = 22). No differences between SA groups are present but the main effects of sensory conditions (p = 0.049) are present. Error bars indicate ±1SD. H, haptic; HAT, haptic abilities test; HSA, high spatial abilities, LSA, low spatial abilities; n, frequency; p, p‐value; S, sighted; SD, standard deviation; SH, sighted haptic; %, percent.
