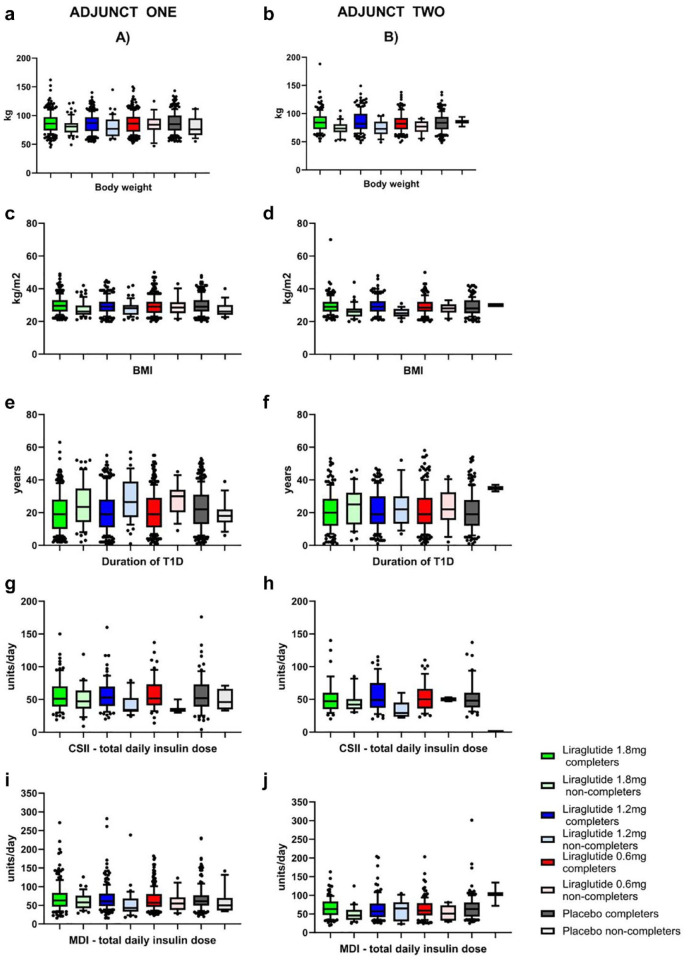
Figure 3.
Boxplots of completers vs non-completers for ADJUNCT ONE (left column of figures) and ADJUNCT TWO (right column of figures) across all three liraglutide dose groups (1.8 mg, 1.2 mg, and 0.6 mg) and placebo for BMI (A, B), body weight (C, D), duration of T1D (E, F), CSII—total daily insulin dose (G, H), and MDI—total daily insulin dose (I, J). Lower and upper bounds of the boxes denote 25th and 75th percentiles of the data sets, and the line inside the box denotes the median value (50th percentile). The whiskers mark the 10th and 90th percentiles, respectively. Values beyond these lower and upper bounds are denoted by individual dots.
Abbreviations: BMI, body mass index; CSII, continuous subcutaneous insulin infusions; MDI, multiple daily insulin injections; SD, standard deviation; T1D, type 1 diabetes.

