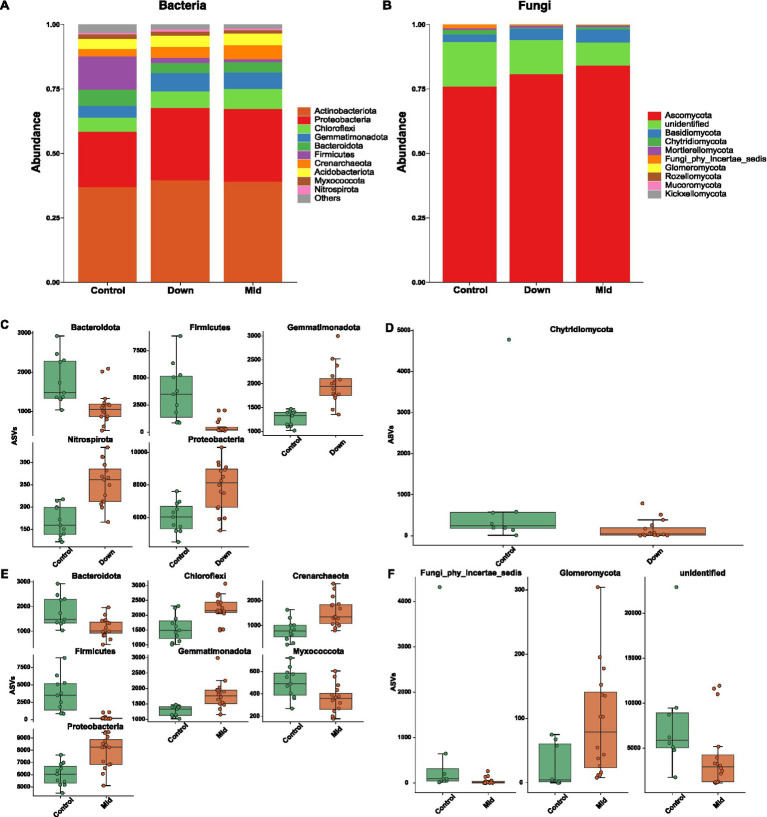
Figure 2.
Microbial compositions of different soils. The 10 most dominant phyla of bacteria (A) and fungi (B) among control, down and mid soils. The varied segments of the bars depict the proportional representation of a specific phylum within each group. Among the 10 most dominant bacterial and fungal phyla, those exhibiting significant differences in abundance (Wilcoxon test with “BH” adjusted p-value <0.05) between control and down soils are shown for bacteria (C) and fungi (D), as well as between control and mid soils for bacteria (E) and fungi (F).

