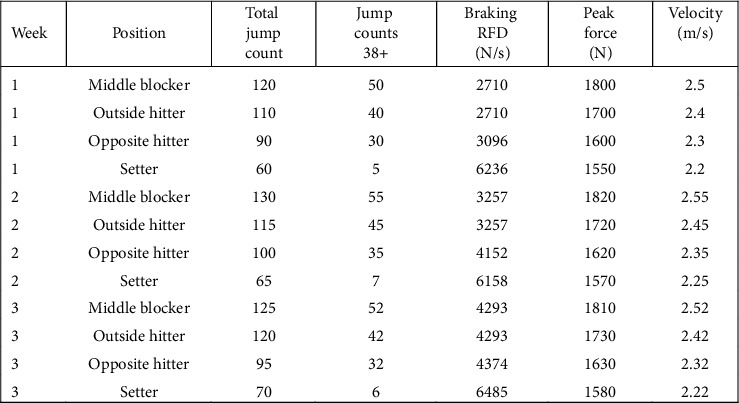
Figure 1.

The example data file demonstrates how jump load data and force plate metrics from CMJ tests were merged and aligned weekly to assess average values for each volleyball position throughout the season. By synchronizing jump load data (including total and high-intensity jump counts) with neuromuscular performance metrics (e.g., force and velocity outputs), the analysis captures the week-to-week impact of training load on neuromuscular fatigue. This alignment allows for a clearer comparison of workload variations and their effects on performance across positions, enhancing the statistical power of the study.
