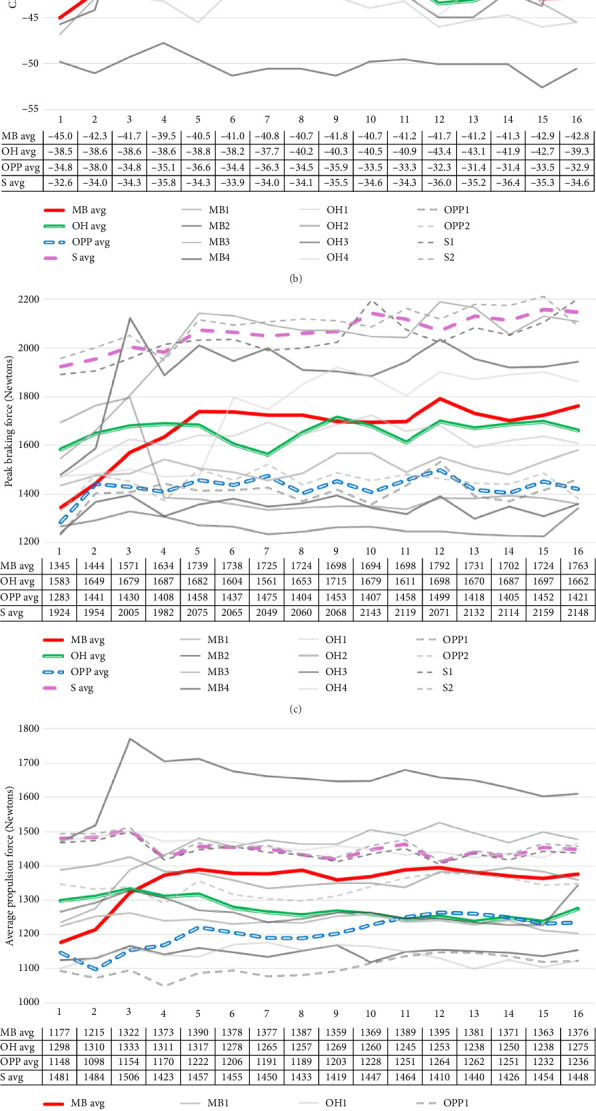
Figure 2.

The graph illustrates jump counts for jumps 50.8 cm or higher, CMJ depth, peak braking force, average propulsion force, and peak braking velocity by position and individual throughout the 16 weeks of the season. Significant interactions for the graphs are reported in Table 1. (a) Weekly average 50+ jump counts by position (color lines) and individual athletes (gray lines). Data show the mean 50+ jump counts. (b) Weekly CMJ depth measures by position (color lines) and individual athletes (gray lines). Data show the mean CMJ depth. (c) Weekly peak braking force by position (color lines) and individual athletes (gray lines). Data show the mean force in Newtons. (d) Weekly average propulsion force by position (color lines) and individual athletes (gray lines). Data show the mean force in Newtons. (e) Weekly average peak braking velocity by position (color lines) and individual athletes (gray lines). Data show the mean velocity in meters per second.
