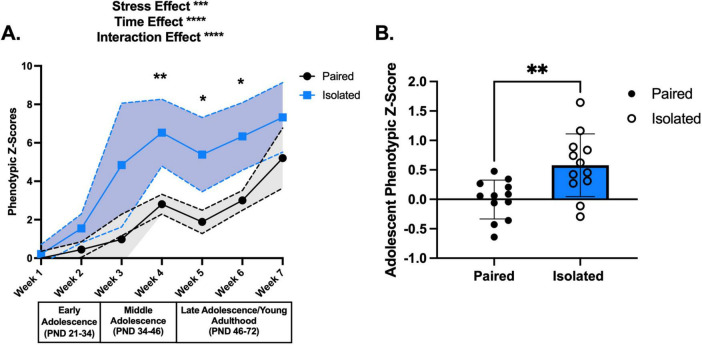
FIGURE 2.
Isolation housing induces greater shifts in phenotypic z scores throughout adolescence compared to Paired housing. (A) Shows the phenotypic z scores for each week for the Paired (black) and Isolated (blue) animals using Paired week 1 as the population baseline. Dashed lines and shaded areas reflect 95% confidence intervals. (B) Adolescent phenotypic z scores calculated from all the behaviors demonstrated statistically significant increase in the isolated compared to the Paired animals. Paired and Isolated, n = 12. Asterisks (*) signify statistically significant differences when comparing Paired and Isolated animals for that week. Data presented with SEM unless otherwise stated. *p < 0.05, **p < 0.01, ***p < 0.001, ****p < 0.0001; mixed effects ANOVA, Sidak Post hoc comparisons. See Supplementary Table 1 for detailed statistics.

