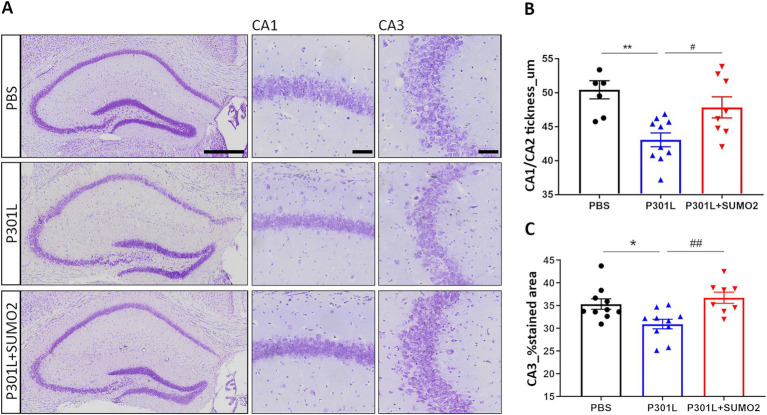
Figure 3.
Analysis of hippocampal CA1 and CA3 thickness in AAV transduced mice. (A) Representative images of hippocampi stained with Cresyl violet showing the entire hippocampus (left panel), CA1 (middle panel) and CA3 (right panel) magnifications (scale bars 50 μm) of mice injected with PBS, P301L-GFP AAV alone, or P301L-GFP AAV in combination with SUMO2-RFP AAV. Scale bar 500 μm. (B) Quantification of the CA1/CA2 thickness and (C) the % stained CA3 area demonstrates a reduction of both parameters in animals expressing TauP301L, and a rescue in mice transduced with P301L + SUMO2 AAVs compared with P301L AAV alone; one-way ANOVA followed by Tukey’s multiple comparisons test; #p < 0,05, **p < 0,001 (n = 6, 10 and 8) and *p < 0.05, ##p < 0.001 (n = 10, 10 and 8) respectively.

