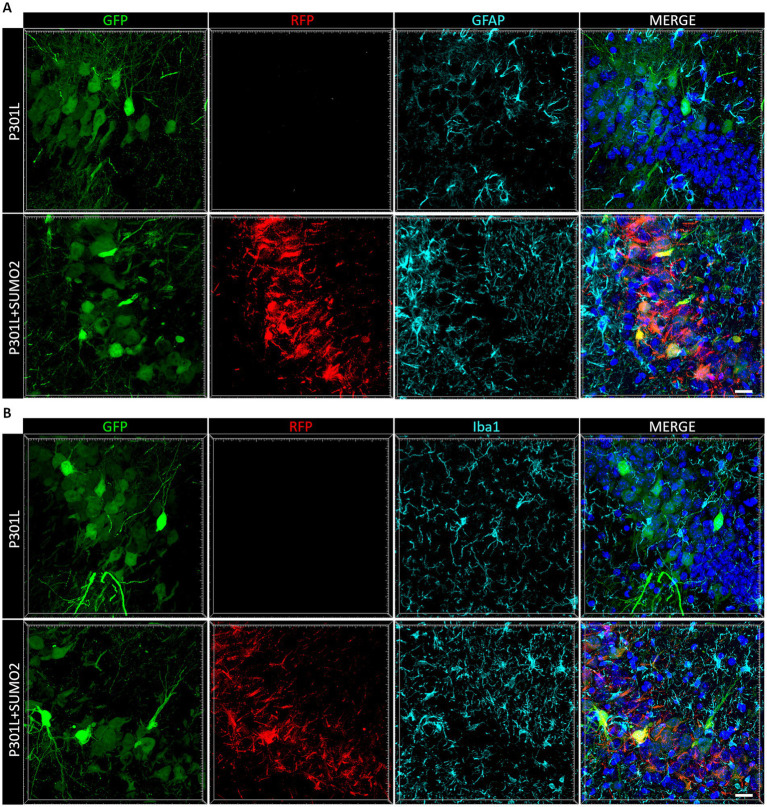
Figure 4.
Analysis of AAVs transduction in non-neuronal cells. Representative images of hippocampal sections of mice transduced with AAV TauP301L (green) alone or in combination with AAV SUMO2 (red) stained with a marker of astrocytes (GFAP, in A) and (B) a marker of microglial cells (Iba1) shown in cyan. Nuclei stained with DAPI (blue) are shown in the right panels merged with the other channels. Neither TauP301L nor SUMO2 AAV are expressed in GFAP-or Iba1-positive cells, scale bar 20 μm.

