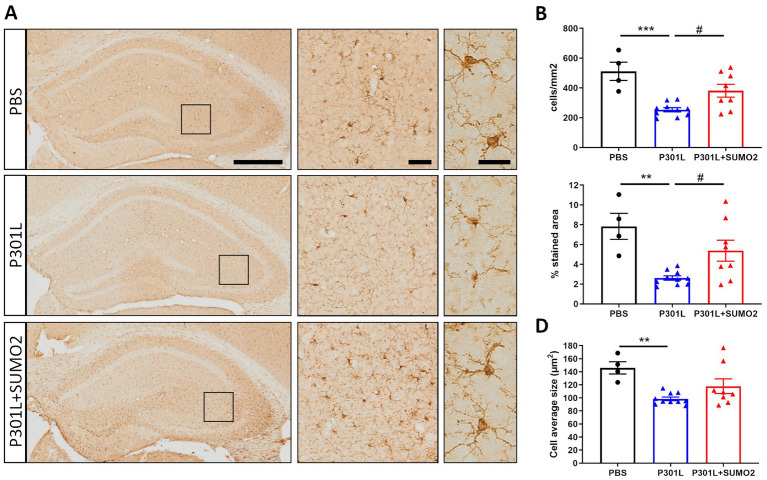
Figure 6.
Morphometric analyses of Iba1 positive microglia in the hippocampi of AAV transduced mice. (A) Representative images of Iba1 staining of mice injected with PBS, P301L-GFP AAV alone, or P301L-GFP AAV in combination with SUMO2-RFP AAV showing the entire hippocampus (scale bar 500 μm), 40x magnification (middle panels, scale bar 50 μm) corresponding to the squares and 60x magnification highlighting 2–3 cells in the brain tissue (right panels, scale bar 20 μm). The quantification of the number of Iba1+ cells/mm2 (B), the percentage of Iba1 stained area (C), and the microglia average size (D) reveal that Tau expression induces a shrinking of microglial cells that is prevented by SUMO2 co-transduction; one-way ANOVA followed by Tukey’s multiple comparisons test; * vs. CTR or # vs. P301L + SUMO2, # or *p < 0.05, ## or **p < 0.001, n = 4,10 and 8.

