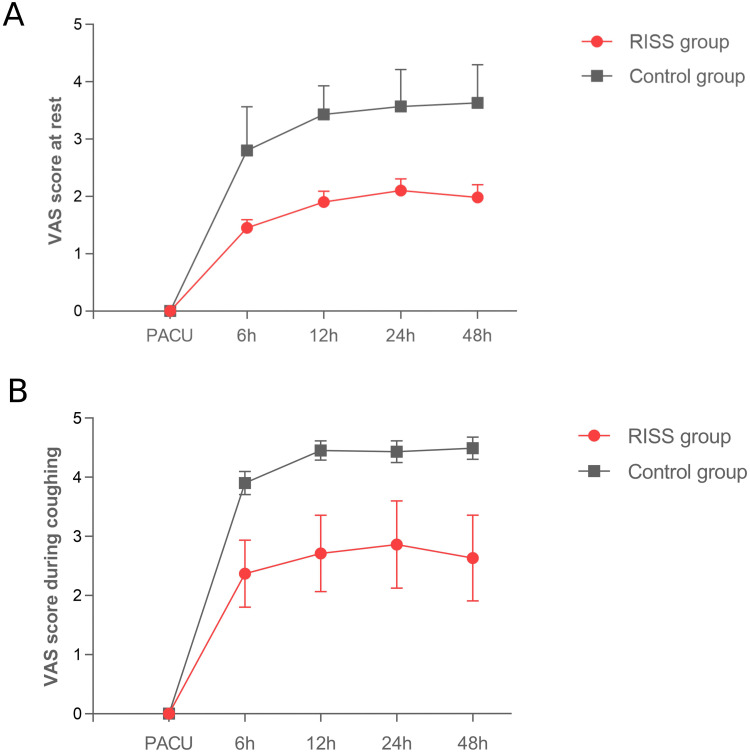
Figure 2.
Comparison of the visual analogue scale (VAS) scores at rest and during coughing postoperatively in RISS and Control group. (A) VAS score at rest (upon admission to the post-anesthesia care unit (PACU), postoperative 6h, 12h, 24h, 48h. (B) VAS score during coughing (upon admission to the post-anesthesia care unit (PACU), postoperative 6h, 12h, 24h, 48h. The Orange lines represent the RISS group, and the blue lines represent the Control group.

