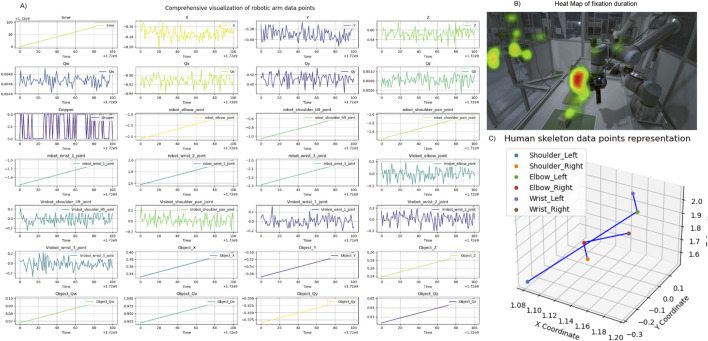
FIGURE 3.
Visualization of data examples from case study 1. (A) Display of randomly selected data points derived from signals gathered and processed during the Programming by Demonstration (PbD) task, featuring varying sampling rates and temporal dynamics. (B) Heatmap representing the cumulative duration of gaze fixations, superimposed on the robotic setup from a side view. (C) Mapping of human posture trajectories, illustrating movement patterns during the interaction.

