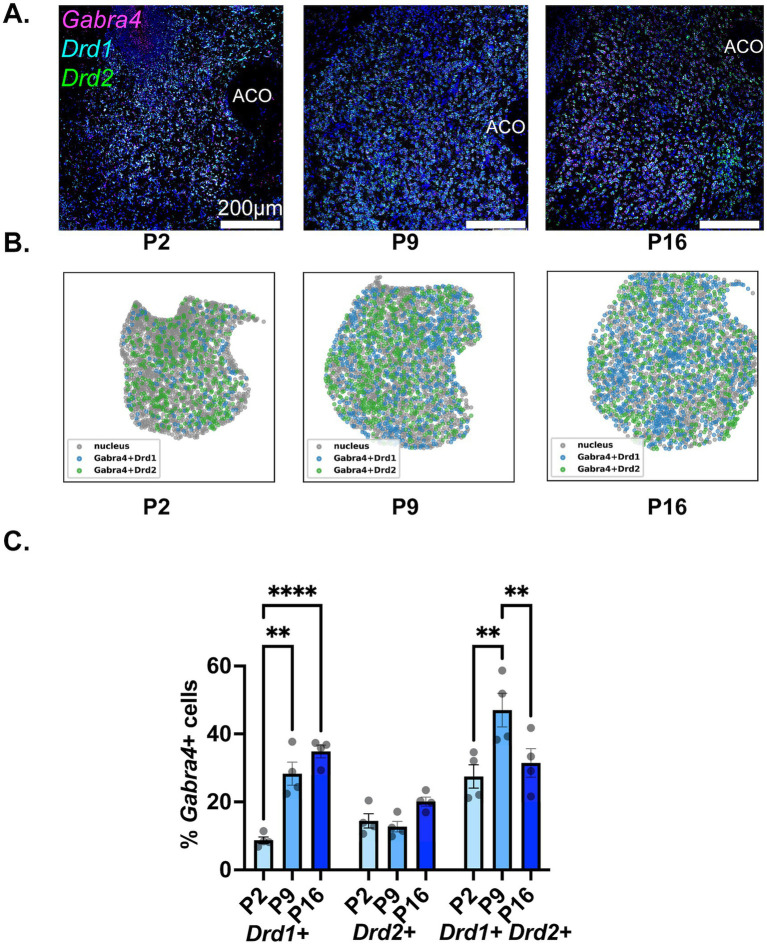
Figure 5.
Developmental changes in the NAc cell-type specific expression of Gabra4. (A) Representative sections from P2, P9, and P16 mice probed for Drd1 (cyan), Drd2 (green), and Gabra4 (magenta). (B) Spatial density plots showing the distribution of Gabra4 expressing Drd1+ and Drd2+ MSNs. (C) Quantification of the percentage of Gabra4 expressing Drd1+, Drd2+, and Drd1+/Drd2+ NAc neurons across the three studied developmental timepoints. **p < 0.01, ****p < 0.0001.

