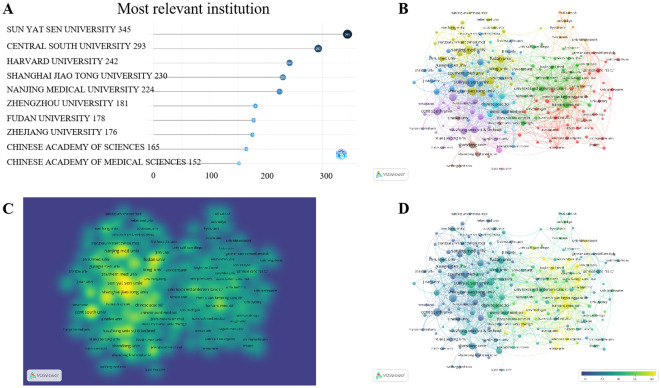
Figure 4.
Institutions publications analysis. (A) represents the total number of publications from the top ten institutions, (B, C) represent the collaboration among institutions, and (D) represents the average number of collaborative publications per institution in the VOSviewer website, the closer to yellow indicates a higher number of publications.

