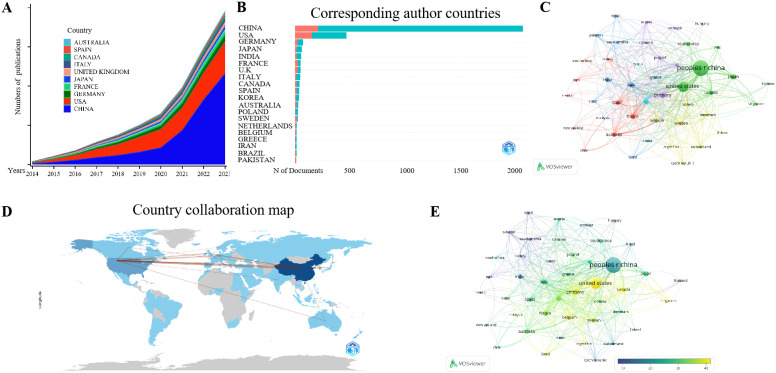
Figure 5.
Analysis of the number of national publications. (A) is a stacked chart of the top ten countries with the largest number of publications in the past ten years. (B) shows the number of publications by the country of the corresponding author. Blue represents publications solely completed by domestic authors, while red represents publications completed through international collaborations. (C, D) illustrate the international cooperation among countries. The depth of color in (D) is positively correlated with the number of publications by the country. (E) represents the average number of citations per publication by country, with yellow indicating a higher average number of citations.

