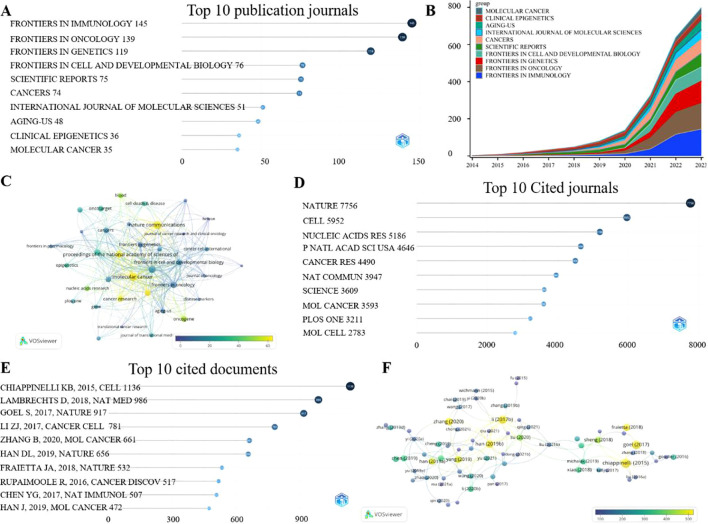
Figure 6.
Analysis of publish journals and highly cited literatures. (A) displays the top 10 journals with the highest number of publications, (B) shows the annual change in publication volume for the top 10 journals, (C) adjusts the publication volume of journals based on the number of citations, with closer to yellow indicating more citations, (D) displays the top 10 journals that are most frequently cited as references, (E) shows the top 10 cited article titles and citation numbers, (F) shows the authors of the highly cited articles. Closer to yellow indicates a higher average number of citations per article.

