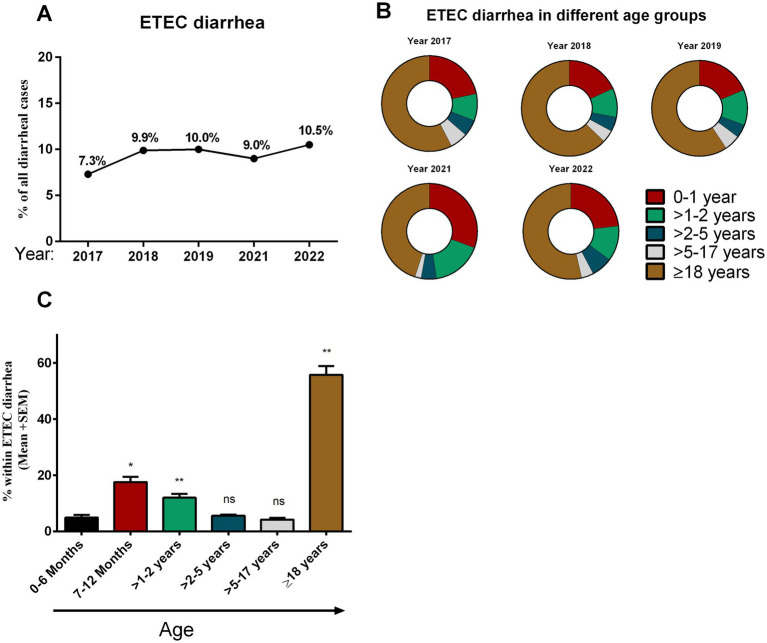
Figure 1.
Enterotoxigenic Escherichia coli (ETEC) diarrhea and its distribution in different age groups. (A) Rate of ETEC diarrhea in different years (2017–2022) among diarrheal patients, (B) distribution of ETEC diarrhea in different age groups in different years and (C) comparison between the rate of ETEC diarrhea in different age groups. Bars indicate Mean + SEM of the percentage of ETEC in any age group among total ETEC cases in five different years. Statistical analysis was performed between 0 and 6 months versus other age groups using the Mann–Whitney U test. *p < 0.05, **p < 0.01, ***p < 0.001; ns, not significant; p > 0.05.

