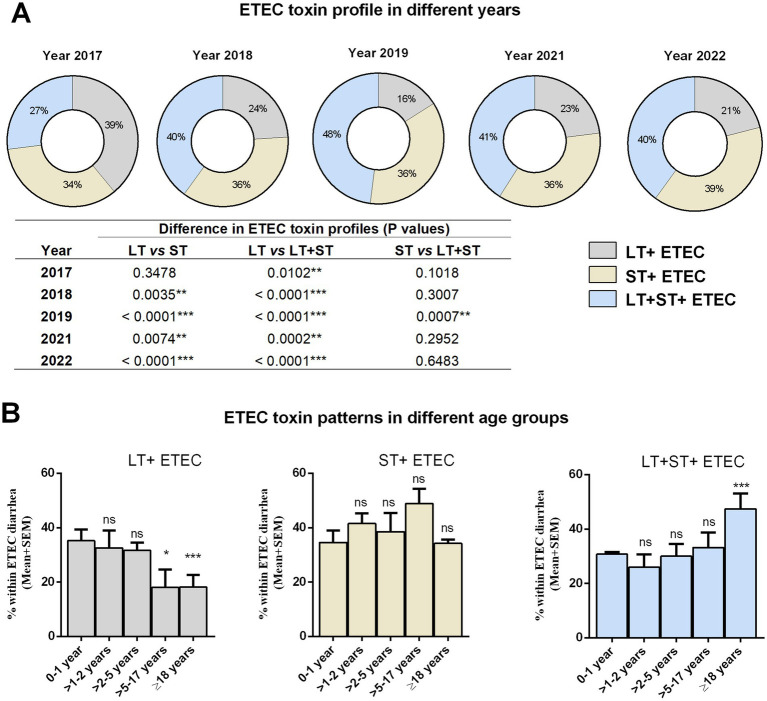
Figure 2.
Distribution of ETEC enterotoxins in different years and age groups. (A) ETEC toxin (LT, ST, and LT + ST) profiles in different years. Statistical analysis was performed between LT vs. ST, LT vs. LT + ST and ST vs. LT + ST using the Chi-square test. (B) ETEC toxin (LT, ST, and LT + ST) profiles in different age groups. Statistical analysis was performed between 0 and 1 years versus other age groups using the Chi-square test. *p < 0.05, **p < 0.01, ***p < 0.001; ns, not significant; p > 0.05.

