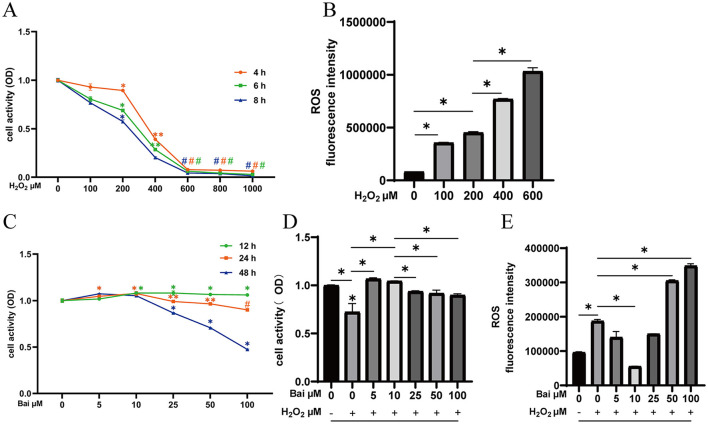
Figure 1.
Exploration of the optimal concentration and time of H2O2 and baicalin. (A) Effect of different concentrations of H2O2 (0, 100, 200, 400, 600, 800, and 1,000 μM) on the cell viability of BMECs upon stimulation for 4, 6, and 8 h. *P < 0.05 compared with the CON, **P < 0.05 compared with the 200 μM H2O2 group, #P < 0.05 compared with the 400 μM H2O2 group. (B) Effect of different concentrations of H2O2 on ROS levels in BMECs upon stimulation for 6 h. *P < 0.05. (C) Effect of different concentrations of baicalin (0, 5, 10, 25, 50, 100 μM) on the cell viability of BMECs upon stimulation for 12, 24 and 48 h. *P < 0.05 compared with the CON, **P < 0.05 compared with the 10 μM baicalin group, #P < 0.05 compared with the 50 μM baicalin group. (D) BMECs were treated with baicalin at different concentrations, and 200 μM H2O2 was added 6 h before the end of treatment to determine the cell viability at 24 h. *P < 0.05. (E) Effect of different concentrations of baicalin on H2O2-induced ROS levels in BMECs. *P < 0.05. The data from the CON were used to normalize the data of each treatment group. Each treatment was repeated three times, and the results are expressed as the means ± SEM.

