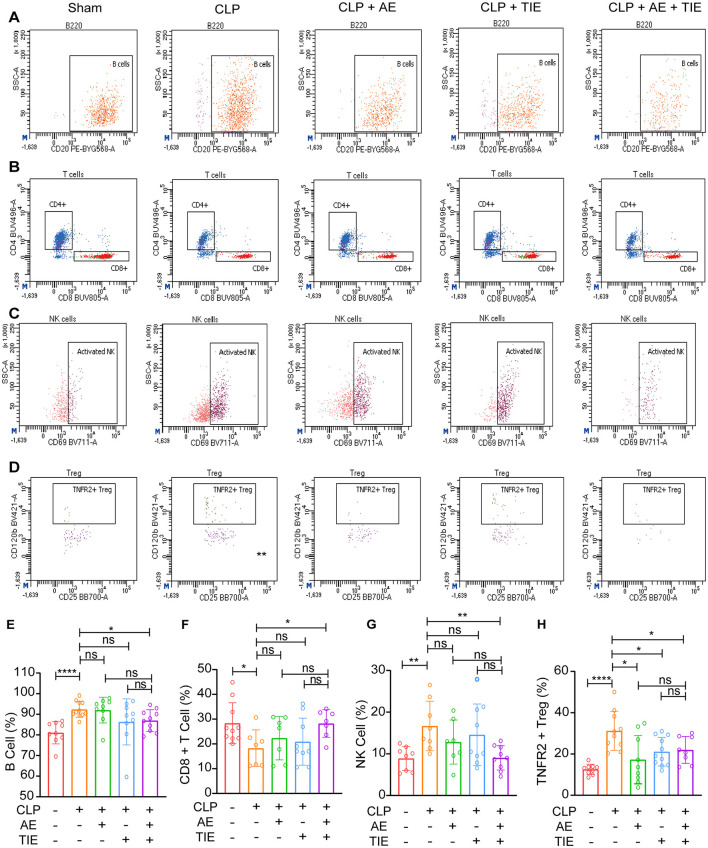
Figure 5.
Impact of AE and TIE treatment on peripheral blood immune cells in septic mice. (A) Gating plots showing B cells. (B) Gating plots depicting CD8+ T cells. (C) Gating plots illustrating NK cells. (D) Gating plots demonstrating TNFR2+ Treg cells. Quantitative analysis of (E) B cells, (F) CD8+ T cells, (G) NK cells, and (H) TNFR2+ Treg cells. Data are expressed as mean ± SEM. Statistical analysis was performed using Tukey's post hoc test following one-way ANOVA (n = 5-10). *P < 0.05, **P < 0.01, and ****P < 0.0001; ns, not significant.

