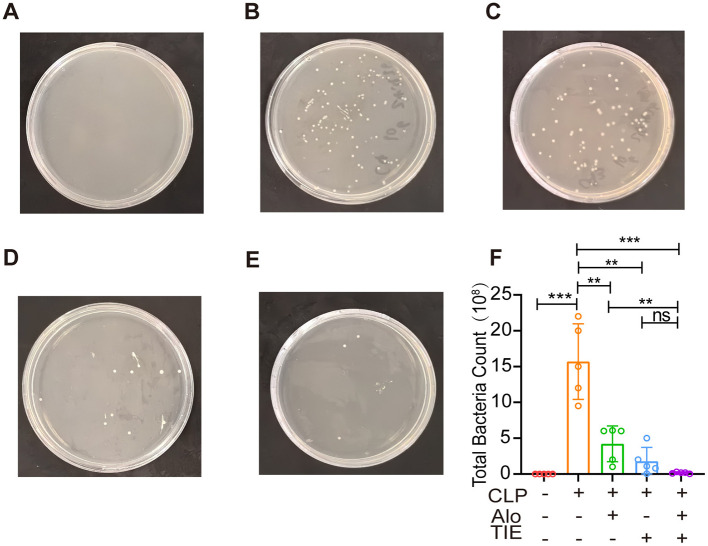
Figure 6.
Effects of AE and TIE treatment on intraperitoneal bacterial contents of mouse model of sepsis. (A–E) Bacterial cultures obtained from ascitic fluids using the spreading method. (A) Sham group, (B) CLP group, (C) AE group, (D) TIE group, (E) AE + TIE group. (F) Quantification of bacterial load analyzed using Tukey's post hoc test following one-way ANOVA. Data are presented as mean ± SEM (n = 5). *P < 0.05, **P < 0.01, ***P < 0.001, and ****P < 0.0001; ns, not significant.

