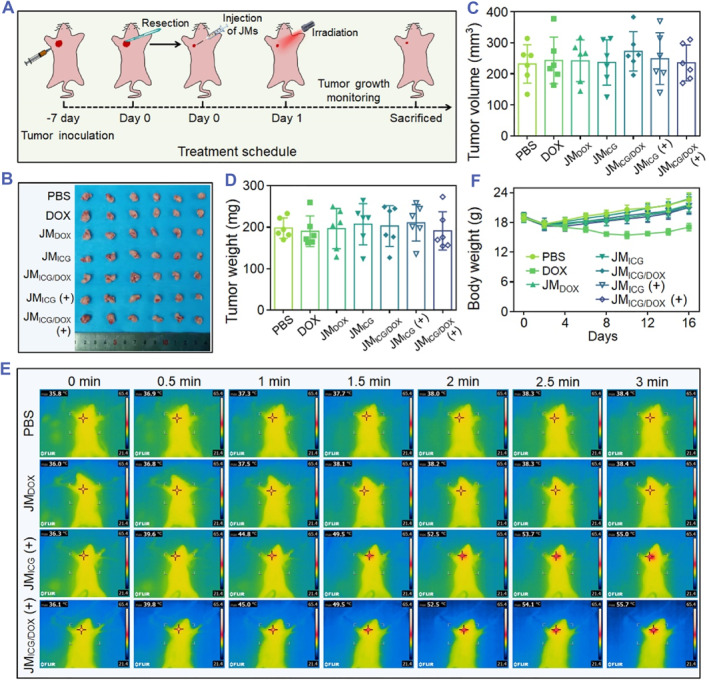
FIGURE 5.

In vivo anti‐tumor procedure of JMs. (A) Schematic illustration of the tumor resection and JMs injection processes. (B–D) Photograph (B), volume (C), and weight (D) of the resected tumors. (E) Infrared thermal imaging of mice subjected to various treatments and exposed to irradiation for 3 min (0.6 W cm−2). (F) The body weight of mice during the 16‐day experiment. Each experimental group had 6 mice (n = 6).
