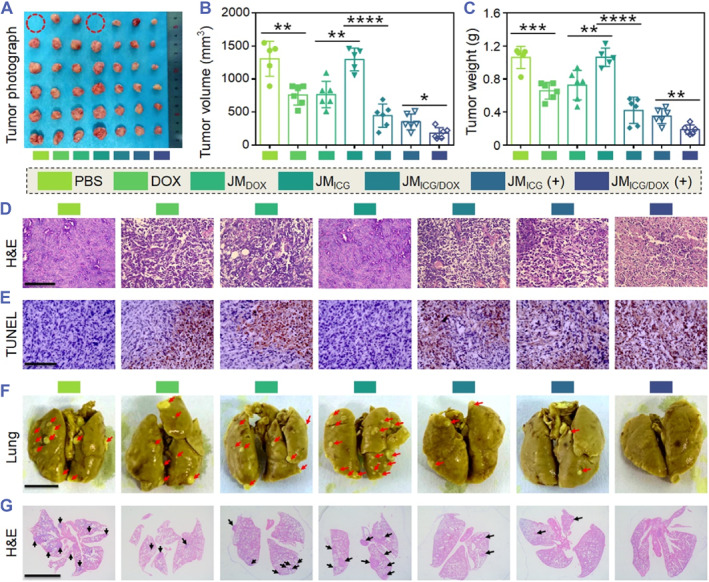
FIGURE 6.

In vivo tumor inhibition and anti‐metastasis ability of the JMs. (A–C) Photograph (A), tumor volumes (B), and tumor weights (C) of 4T1‐tumor‐bearing mice after various treatments. The dotted red circles indicate the dead mice during the experiment. (D, E) H&E (D) and TUNEL (E) analyses of different groups (Scale bars: 100 μm). (F, G) Representative photographs (F) and H&E (G) staining of lungs with pulmonary metastatic nodules (indicated with red arrows and black arrows) after various treatments (Scale bars: 5 mm). Each experimental group had five mice (n = 6). Data are presented as the mean ± SD. *p < 0.05, **p < 0.01, ***p < 0.001.
