

Summary
Background
Varying obesogenic inherited predisposition in early to later life may differentially impact colorectal cancer (CRC) development. Previous Mendelian randomization (MR) studies, conducted in populations of European genetic similarity, have not observed any significant associations between early life body weight with CRC risk. However, it remains unclear whether body mass index (BMI) at different early lifetime points is causally related with CRC risk in both Europeans and East Asian populations.
Objectives
We conducted a two‐sample MR study to investigate potential causal relationships between genetically predicted BMI during early life (birth to 8 years old) and at specific periods (birth, transient, early rise and late rise) and CRC risk.
Methods
Summary data were obtained from genome‐wide association study (GWAS) of BMI in 28 681 children from the Norwegian Mother, Father and Child Cohort Study (MoBa) study and applied to CRC GWAS data from European and East Asian descent populations (102 893 cases and 485 083 non‐cases).
Results
There were no significant associations observed between early life BMI and CRC risk in European or East Asian populations. The effect estimates were similar in European studies (odds ratio [OR] per a 1‐standard deviation [SD] increase: 1.01, 95% confidence interval [CI]: 0.95, 1.07) and in East Asians (OR per a 1‐SD increase: 1.02, 95% CI: 0.91, 1.14). Similar nonsignificant associations were found between time of BMI measurement during childhood and cancer‐site‐specific analyses.
Conclusions
We found little evidence of any associations between early life adiposity on later life CRC risk.
Keywords: colorectal cancer, early life, mendelian randomization, obesity
1. INTRODUCTION
In recent decades, the increasing prevalence of childhood obesity in most world regions has become an important health problem. 1 There is substantial evidence from observational studies linking early life adiposity with increased risks of chronic diseases, including cancers. 1 , 2 , 3 , 4 Therefore, more prevalent obesity from younger ages can have important consequences for population health, regardless of body size in adulthood. Colorectal cancer (CRC) is one of the most common cancer types globally with almost 2 million new cancer cases and over 900 000 related deaths in 2020. 5 CRC has a long latency period meaning that exposures across long life periods occurring many years before diagnosis may be etiologically implicated. It is thus plausible that childhood constitutes a critical period during which adiposity can affect the future development of obesity related cancers in adulthood. 6 Furthermore, obesity during early life has been linked with unfavourable metabolic profiles that may affect cancer risk. 7 Therefore, it is possible that the obesity in early life periods including infancy and childhood may increase the risk of CRC in later life.
Most of the current evidence comes from conventional observational studies. Two meta‐analyses have reported positive associations between early life body size and later life CRC risk in both men and women. 8 , 9 However, causal inference is limited due to the inherent biases of these epidemiological study designs, such as residual confounding, recall bias, selection bias, and reverse causality. 10 , 11 Mendelian randomization (MR) is an alternative approach to investigate potential causal associations using germline genetic variants as proxies for exposures of interest to allow causal inference between a given exposure and outcome. 12 In contrast to observational analyses, MR analyses are less susceptible to confounding and reverse causality due to the random assortment of alleles at meiosis and germline genetic variants being fixed at conception, and thus unaffected by the disease process. 13 To this end, recently several MR studies have been conducted which did not provide any evidence of effect of early life adiposity on CRC. 14 , 15 , 16 However, some of these studies derived their genetic instruments based on recalled body size information from adults or focused on a specific time point (age of 10) 15 , 16 or did not conduct sex or CRC site‐specific analyses. 14 , 15
In the current study, we conducted a two‐sample MR analysis to explore potential causal associations between body mass index (BMI) at infancy and early life (up to 8 years) with CRC risk in adulthood. Genetic instruments for BMI were derived from a recent genome‐wide association study (GWAS) of 28 681 children. 17 Information on GWAS of CRC risk was obtained from two large CRC European genetic consortia. 18 , 19 , 20 Finally, due to the lack of similar studies in Asian populations, we also conducted an exploratory MR analysis using CRC data from a consortium with participants of East Asian genetic similarity. 21
2. METHODS
2.1. Summary genetic data on early life body size
Genetic variants associated with early life BMI were identified from a recent GWAS of 28 681 children of European genetic similarity from the Norwegian Mother, Father, and Child Cohort Study (MoBa). 17 Length/height and weight of the children were measured at hospitals at birth and during visits in the primary health care system by nurses at 6 weeks, 3, 6 and 8 months, and 1, 1.5, 2, 3, 5, 7 and 8 years of age. 17 A linear mixed model was conducted using BOLT‐LMM (v2.3.4) adjusting for batch, sex, pregnancy duration and 10 principal components as covariates used to conduct the GWAS analysis. 17 Forty‐six SNPs were identified that were genome‐wide significant for at least one time point. In our analysis, we included 39 independent (linkage disequilibrium R 2 < 0.01) SNPs with an effect allele frequency over 0.01, out of which eight were exclusively related to BMI at birth and the remaining 31 to early life BMI. Furthermore, three subgroups of SNPs for early life BMI which correspond to distinct biological processes were defined in the original GWAS and were used in our analysis. 17 More specifically, after birth, BMI increases till a maximum value at the age of 9 months and then followed by a gradual decline reaching a minimum point around the 5–6 years of age. These two time points are known as the adiposity peak (AP) and adiposity rebound (AR) points. Consequently, the ‘transient’ group (17 SNPs) includes SNPs with no effect at birth, a peak association during infancy or early childhood, and little or no effect after the AR point. The ‘early rise’ group (10 SNPs) includes SNPs that show a gradually stronger association with BMI from infancy into childhood, plateauing at AR and 7 to 8 years of age. Finally, the ‘late rise’ group (4 SNPs) includes SNPs that show little to no association before AR while they show a large increase after this point. The 39 SNPs used as instruments were identified in 37 loci demonstrating a small overlap between the phenotypes. Tables S1 and S2 include the SNPs that were used in our analysis.
2.2. Summary genetic data on colorectal cancer (CRC)
Summary data for the associations of the early life BMI associated genetic variants with CRC risk in participants of European and East Asian genetic similarity were obtained from CRC GWAS studies within three genetic consortia. For overall CRC, we used summary‐level data from a meta‐analysis of 16 GWASs, including 160 527 adults (73 673 cases and 86 854 controls) of European genetic similarity. 20 Data on sex and site‐specific CRC (colon, proximal colon, distal colon and rectum) were collected from a meta‐analysis of three genetic consortia within ColoRectal Transdisciplinary Study (CORECT), the Colon Cancer Family Registry (CCFR), and the Genetics and Epidemiology of Colorectal Cancer (GECCO). 18 Finngen combined imputed genotype data integrated from Finnish biobanks and digital health registry records, and it is frequently updated. 19 The version (R10) includes 412 181 participants out of which 4143 developed colon cancer and 2490 rectal cancer. (https://r8.risteys.finngen.fi/phenocode/C3_COLORECTAL). Summary data from Finngen was used only in the site‐specific analyses as Finngen was also part of the latest CRC GWAS study we used in the overall CRC analysis. The Asia Colorectal Cancer Consortium (ACCC) includes 72 272 participants (23 572 cases and 48 700 controls) of East Asian genetic similarity from 15 studies conducted in China, Japan and South Korea. 22 All cancer estimates from the three consortia are presented in the Tables S3–S8.
Regarding the summary data used in the MR analyses, informed consents were obtained from the participants and study protocols were approved by respective institutional review boards. 17 , 18 , 19 , 20 , 22
3. STATISTICAL ANALYSIS
3.1. Mendelian randomization
A two‐sample MR approach using summary data and the random effects inverse variance weighting (IVW) method was implemented. MR studies depend on three main assumptions for their estimates to be valid: (1) the genetic instrument is strongly associated with the exposure; (2) the genetic instrument is not associated with any potential confounder of the exposure—outcome association; and (3) the genetic instrument does not affect the outcome independently of the exposure (i.e., exclusion of horizontal pleiotropy). The strength of each genetic instrument can be evaluated through the F‐statistic using the following formula: , where R 2 is the proportion of the variability of the exposure explained by each instrument and N the sample size of the GWAS for the SNP‐ early life BMI association. To calculate the R 2 for the genome‐wide significant SNPs the following formula was used: , where EAF is the effect allele frequency and beta is the estimated genetic effect on BMI. Cochran's Q was computed to quantify heterogeneity across the individual causal effects, with a p‐value ≤0.05 indicating the presence of pleiotropy. 23 , 24
Several sensitivity analyses were conducted to identify and correct for the presence of horizontal pleiotropy in our results. MR‐Egger regression provides valid MR estimates in the presence of horizontal pleiotropy when the pleiotropic effects of the genetic variants are independent from the genetic associations with the exposure. 25 Deviations from zero for the intercept test denote the presence of horizontal pleiotropy across the genetic variants. In such a case, the slope of the MR‐Egger regression provides valid MR estimates when the pleiotropic effects of the genetic variants are independent from the genetic associations with the exposure. 25 , 26 Additionally, the statistic was calculated to estimate the expected relative bias of the MR‐Egger causal estimate in the context of a two‐sample MR. 27 Moreover, causal estimates were also computed using the weighted‐median method that provides valid MR estimates under the presence of horizontal pleiotropy when up to 50% of the included instruments are invalid. 28 The MR pleiotropy residual sum and outlier test (MR‐PRESSO) was also used to assess the presence of pleiotropy. The MR‐PRESSO test relies on a regression framework to identify outlying genetic variants which may potentially be pleiotropic. Thereupon, we repeated the analysis after excluding these outlying variants. 29
The statistical power for the MR analysis was calculated a priori using an online tool at https://sb452.shinyapps.io/power/. 30 Given a type 1 error of 5%, for early life BMI an expected OR per 1 standard deviation (SD) ≥1.06 and ≥1.1 was needed to have adequate statistical power (>80%) in GECCO and ACCC, respectively. Table 1 presents the power estimates under different scenarios for the five exposures. All the results correspond to a 1‐SD increase in early life BMI.
TABLE 1.
Sample size and statistical power in Mendelian randomization (MR) study of early body mass index (BMI) and colorectal cancer (CRC) risk.
| Exposure | Study | Sample size | Ratio of cases to controls | Selected scenarios a | ||||
|---|---|---|---|---|---|---|---|---|
| OR = 1.05 | OR = 1.1 | OR = 1.15 | OR = 1.2 | OR = 1.25 | ||||
| Birth | CRC consortium | 160 527 | 0.85 | 0.28 | 0.77 | 0.98 | 1.00 | 1.00 |
| ACCC | 72 272 | 0.47 | 0.13 | 0.39 | 0.69 | 0.89 | 0.97 | |
| Early life | CRC consortium | 160 527 | 0.85 | 0.67 | 1.00 | 1.00 | 1.00 | 1.00 |
| ACCC | 72 272 | 0.47 | 0.32 | 0.82 | 0.99 | 1.00 | 1.00 | |
| Transient | CRC consortium | 160 527 | 0.85 | 0.39 | 0.91 | 1.00 | 1.00 | 1.00 |
| ACCC | 72 272 | 0.47 | 0.18 | 0.53 | 0.85 | 0.97 | 1.00 | |
| Early rise | CRC consortium | 160 527 | 0.85 | 0.28 | 0.77 | 0.98 | 1.00 | 1.00 |
| ACCC | 72 272 | 0.47 | 0.13 | 0.39 | 0.69 | 0.89 | 0.97 | |
| Late rise | CRC consortium | 160 527 | 0.85 | 0.16 | 0.48 | 0.80 | 0.95 | 0.99 |
| ACCC | 72 272 | 0.47 | 0.09 | 0.22 | 0.41 | 0.62 | 0.79 | |
Note: The numbers under the OR columns in the selected scenarios section correspond to the statistical power of our analysis for each of the five exposure variables given a specific value of OR.
Abbreviation: ACCC, Asian colorectal cancer consortium; CRC, colorectal cancer; OR, odds ratio.
Type 1 error of 5% and a proportion of variance explained equal to 2%, 6%, 3%, 2% and 1% are assumed for birth, overall early life, transient, early rise and late rise periods, respectively.
As a final step, we conducted a random effects meta‐analysis in the cases of colon and rectal cancer combining the results from CCFR, CORECT and GECCO with Finngen to get an overall estimate using the metan command in Stata (College Station, Texas), and heterogeneity between the two studies was quantified using the I 2 statistic. 31
MR analyses were performed using R (Vienna, Austria) version 4.3.3, using the “MendelianRandomization” (version 0.9) package. The current study followed the Strengthening the Reporting of Observational Studies in Epidemiology using Mendelian Randomization (STROBE‐MR) guidelines.
4. RESULTS
Figure 1 shows the results for overall early life BMI where no relationships were observed between genetically predicted BMI in early life and CRC risk. The odds ratio (OR) per 1‐SD increase of overall early life BMI in the CRC consortium was 1.01 (95% confidence interval [CI]: 0.95, 1.07). Similar non‐significant risk estimates were also observed in the site‐specific analyses (Figure 1).
FIGURE 1.
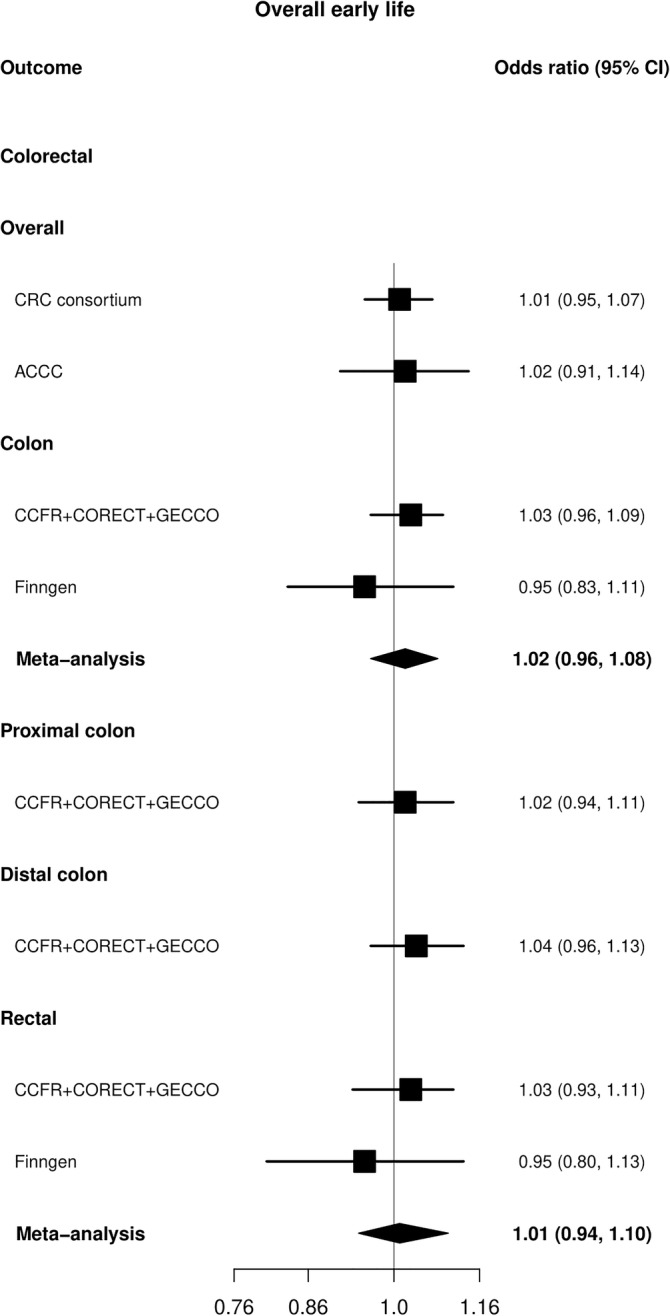
Mendelian randomization (MR) analysis for early life BMI (31 SNPs) in relation to colorectal cancer (CRC) in GECCO, Finngen and Asia Colorectal Cancer Consortium (ACCC). The x axis corresponds to an OR change per 1 standard deviation increase in BMI. The MR result corresponds to a random effects model. OR, odds ratio (black filled square); 95% CI, 95% confidence interval (black line); SNP, single nucleotide polymorphism.
Examination of BMI at specific time periods also indicated no evidence of an association. Although, in Finngen some opposite but imprecise effects were observed for rectal cancer between genetically predicted BMI in the early rise phase (OR: 0.79, 95% CI: 0.55, 1.11) compared with the late rise phase (OR: 1.27, 95% CI: 0.84, 1.93) with overlapping CIs (Figure 2 and Tables S9–S13). The sex‐specific analysis in GECCO also did not identify any associations of birth or early life BMI with CRC risk (Figure S1). The analysis in ACCC also did not indicate any apparent effects of early life BMI and overall CRC risk (OR: 1.02, 95% CI: 0.91, 1.14) (Figure 1).
FIGURE 2.
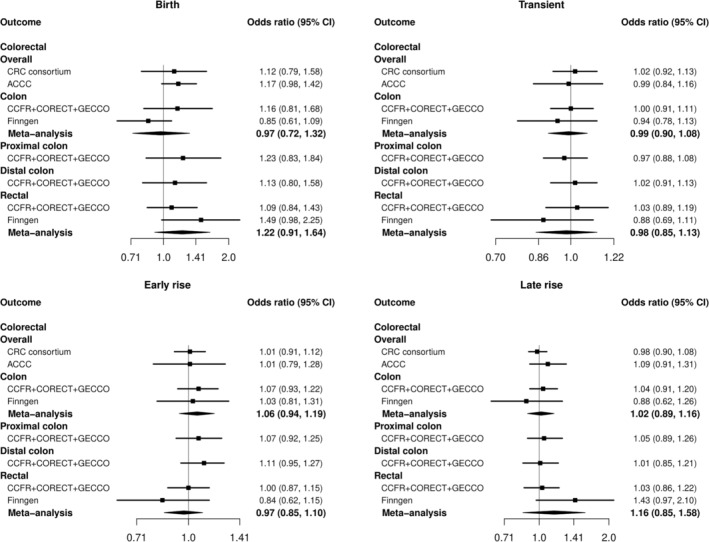
Mendelian randomization (MR) analysis for BMI at birth (8 SNPs) as well as in specific time periods (transient: 17 SNPs, early rise: 10 SNPs, late rise: 4 SNPs) in relation to colorectal cancer (CRC) in GECCO, Finngen and Asia Colorectal Cancer Consortium (ACCC). The x axis corresponds to an OR change per 1 standard deviation increase in BMI. The MR result corresponds to a random effects model. OR, odds ratio (black filled square); 95% CI, 95% confidence interval (black line); SNP,‐ single nucleotide polymorphism.
Based on the F‐statistics, the genetic instruments were deemed strong (F‐statistic all ≥35) (Table S1). There was some evidence of heterogeneity mainly in the analysis of birth BMI (maximum p‐value for the Q statistic 0.003) (Table S13). Additionally, Egger's intercept test showed some evidence of directional pleiotropy in the analyses of overall early life BMI and risk of overall colorectal and colon cancer (Table S9). The MR‐Egger regression effect for colon cancer was stronger than the IVW approach (OR: 1.25, 95% CI: 1.02, 1.52) (Table S9). However, the statistic was low (<55%) meaning that there is evidence of weak instrument bias in these results and additionally the weighted median approach also did not show any positive effects. The MR‐PRESSO technique identified two outlying SNPs (rs1032296 and rs1772945) both present in the analysis of overall early life and transient BMI and overall CRC risk; however, their exclusion had minimal effect on the observed associations (Tables S9 and S10). Additionally, five out of the eight SNPs (rs11708067, rs1482853, rs11187129, rs7310615 and rs739669) in the analysis of birth BMI were also identified as outliers; however, the inference did not change after their exclusion from the genetic instrument (OR: 1.08, 95% CI: 0.90, 1.30) (Table S13).
5. DISCUSSION
In the current study, genetically predicted early life BMI, both in overall and measured at different time periods, did not show a significant association with CRC risk in adulthood. Furthermore, our analysis in a population of Asian descent also did not identify any potential associations either.
Recently, several MR studies have addressed this question using different approaches. The first study examined the associations between childhood obesity and cancer risk, creating a genetic instrument of 15 SNPs from a GWAS of 47 541 children from the Early Growth Genetics consortium. 14 The results of this study did not support any positive relationship between genetically predicted childhood BMI and overall CRC (OR: 1.11, 95% CI: 0.93, 1.32). However, the SNPs in this GWAS were derived from a meta‐analysis of studies where the phenotype analysed was BMI at the latest time point between 2 and 10 years. 32 Therefore, we cannot exclude potential bias in the results given the mixing of results coming from studies with different protocols using different time‐specific endpoints. Two additional MR studies using an instrument of body size at the age of 10 from UK Biobank (UKBB) also did not report any significant associations after adjusting for body size during adulthood, although there was a weak evidence of a positive effect for distal colon cancer (OR: 1.27, 95% CI: 0.90, 1.77). 15 , 16 However, under the univariable MR framework positive effect estimates were found for overall colon (OR: 1.16, 95% CI: 1.00, 1.35) and distal colon (OR: 1.25, 95% CI: 1.04, 1.51) cancer. 16 In our analysis, we did not observe similar results either for overall early life or time‐period specific BMI. Potential reasons could be the difference in the size between the two GWASs used to obtain the SNPs included in the genetic instrument as well as the different phenotypes. The previous publication used the summary of a much larger GWAS of early life body size within the UKBB thus increasing the power of the analysis. Moreover, in contrast to our analysis where SNPs of measured BMI were used, the exposure in UKBB was based on a self‐reported questionnaire of early life body type at the age of 10 years (thinner, plumper or about average) than on direct measurements, which could potentially introduce recall bias in the measurements.
There is also additional evidence from observational studies. Two recent meta‐analyses have both reported an increased CRC risk in adulthood for elevated BMI assessed during adolescence or early adulthood (maximum age: 30 years). More specifically, the first meta‐analysis found that men with obesity had 39% higher CRC risk during late adulthood compared with men without obesity while the risk was 19% in women. 8 Furthermore, the second meta‐analysis reported that each 5 kg/m2 increase in BMI was associated with a 13% higher CRC risk in men and women combined, with the risk being higher in men than in women. 9 An additional large Israeli study of almost 1.8 million men and women reported that being overweight and obese at adolescence was linked with higher colon cancer risk for both men (Hazard ratio [HR] for overweight: 1.53, 95% CI; 1.28, 1.84; HR for obesity: 1.54, 95% CI: 1.15, 2.06) and women (HR for overweight: 1.54, 95% CI: 1.22, 1.93; HR for obesity: 1.51, 95% CI: 0.89, 2.57). However, information on important potential confounders such as adult BMI, diet, alcohol, and smoking was missing. 33 Additionally, our study focused on an earlier time point than most of the observational studies. Also, contrary to MR analyses, these studies can also be prone to additional biases like recall and selection bias due to their observational nature as mentioned earlier.
To our knowledge, there are no studies conducted in Asian populations regarding the role of obesity during early life and CRC risk. However, current evidence from MR studies supports a positive link between adult adiposity and CRC, aligning with results from studies conducted in populations of European genetic similarity. More specifically, a recent MR study in Japanese participants indicated that a one‐unit increase in genetically predicted BMI increased CRC risk by 13% (OR: 1.13, 95% CI: 1.06, 1.20). 34 Our results in ACCC did not find any associations between early life BMI and CRC; however, GWAS studies of early life BMI in populations of East Asian genetic similarity are required to give more precise answers.
To our knowledge, the current MR study is the first one that tried to investigate the role of early life BMI at different time periods and CRC in adulthood using genetic instruments strongly associated with early life BMI, as denoted by the large values for the F‐statistic. We also conducted tumour subsite specific analyses to further inspect the role of early life adiposity on CRC risk. Another strength comes from the MoBa study which was able to conduct detailed time‐specific analyses rather than just combining data from studies performed under different protocols and time points. 17 Furthermore, there was no overlap between the exposure and outcome studies which could lead to biased results. 35 Additionally, measured rather than self‐reported BMI was used in the body size GWAS, which is less likely prone to recall bias, while the inclusion of sex‐specific and cancer‐site‐specific analyses allowed us to conduct more detailed analyses. Also, MR‐Egger and MR‐PRESSO methods were also applied to examine the robustness of our results given that in general the BMI‐related variants tend to be pleiotropic. Finally, the MR design is less prone to the limitations of observational studies while the consistency among the different MR methods applied strengthens the robustness of the results.
The main limitation was the small sample size of the MoBa study which resulted in a relatively small number of identified SNP that could be used in our analysis. A direct consequence of that is the limited statistical power of our analysis, especially for the different cancer subtypes. However, this detailed data collection at several time points since birth is valuable and future, larger GWAS studies should follow the same paradigm which will allow the identification of a larger number of genetic variants. The genetic instruments were selected from a single cohort of Norwegian children, and further research is needed to evaluate the generalizability of the results to other populations. Additionally, body composition as well as the allele frequencies of the SNPs that were used in the MR analysis are in general different between populations of European and East Asian genetic similarity. Given differences in linkage disequilibrium across different population it is likely that the instrument is weaker in East Asians. Similarly, we cannot exclude the presence of confounding due to population stratification in the analysis of East Asians since the SNP‐early life BMI GWAS was undertaken in a different study population than the SNP–CRC GWAS. 13 Consequently, caution is needed when interpreting the results from the ACCC analysis. As mentioned earlier, GWAS of early BMI in populations of Asian genetic similarity are needed to produce more valid results. Unfortunately, we are not aware of any data in East Asian populations that have BMI measured early in life and have GWAS data to assess if our instrument is stable in East Asians. Therefore, this analysis is more of an exploratory nature untill such GWAS studies become available. In our analysis, seven SNPs mainly in “late rise” cluster have also been linked with BMI during adulthood. 17 However, our sensitivity analyses generated results consistent with the main findings. Additionally, given the null associations, any effect of adult BMI is minimal.
In summary, our current study did not find any statistically significant support for causal effects of BMI at birth or during childhood with risk of CRC in adulthood. Larger GWAS studies from different populations and with measures of BMI at different time points during childhood are needed to better identify potential critical periods of weight and weight change in early life in relation to CRC development in adulthood.
AUTHOR CONTRIBUTIONS
Concept and design: Hughes, Jenab and Murphy. Statistical analysis: Papadimitriou. Writing—drafting of the manuscript: Papadimitriou. Writing—review and editing: all authors. Data curation: Zheng and Peters.
FUNDING INFORMATION
This work was supported by funding from the International Health Cohorts Consortium/Global Genomic Medicine Collaborative (IHCC/G2MC) No.31312020 (to D.J.H, M.J, N.M). The Asia Colorectal Cancer Consortium is funded, in part, by NIH grant R01CA188214 (to W.Z.) and endowment for Anne Potter Wilson professorship (to W.Z).
Genetics and Epidemiology of Colorectal Cancer Consortium (GECCO): National Cancer Institute, National Institutes of Health, U.S. Department of Health and Human Services (U01 CA164930, U01 CA137088, R01 CA059045, R21 CA191312, R01201407). Genotyping/Sequencing services were provided by the Center for Inherited Disease Research (CIDR) contract number HHSN268201700006I and HHSN268201200008I. This research was funded in part through the NIH/NCI Cancer Center Support Grant P30 CA015704. Scientific Computing Infrastructure at Fred Hutch funded by ORIP grant S10OD028685.
ASTERISK: a Hospital Clinical Research Program (PHRC‐BRD09/C) from the University Hospital Center of Nantes (CHU de Nantes) and supported by the Regional Council of Pays de la Loire, the Groupement des Entreprises Françaises dans la Lutte contre le Cancer (GEFLUC), the Association Anne de Bretagne Génétique and the Ligue Régionale Contre le Cancer (LRCC).
The ATBC Study is supported by the Intramural Research Program of the U.S. National Cancer Institute, National Institutes of Health, Department of Health and Human Services.
CLUE II funding was from the National Cancer Institute (U01 CA086308, Early Detection Research Network; P30 CA006973), National Institute on Aging (U01 AG018033) and the American Institute for Cancer Research. The content of this publication does not necessarily reflect the views or policies of the Department of Health and Human Services, nor does mention of trade names, commercial products or organizations imply endorsement by the US government. Maryland Cancer Registry (MCR) Cancer data were provided by the Maryland Cancer Registry, Center for Cancer Prevention and Control, Maryland Department of Health, with funding from the State of Maryland and the Maryland Cigarette Restitution Fund. The collection and availability of cancer registry data are also supported by the Cooperative Agreement NU58DP006333, funded by the Centers for Disease Control and Prevention. Its contents are solely the responsibility of the authors and do not necessarily represent the official views of the Centers for Disease Control and Prevention or the Department of Health and Human Services.
ColoCare: This work was supported by the National Institutes of Health (grant numbers R01 CA189184 [Li/Ulrich]), U01 CA206110 (Ulrich/Li/Siegel/Figueiredo/Colditz, 2P30CA015704–40 [Gilliland], R01 CA207371 [Ulrich/Li]), the Matthias Lackas‐Foundation, the German Consortium for Translational Cancer Research and the EU TRANSCAN initiative.
The Colon Cancer Family Registry (CCFR, www.coloncfr.org) is supported in part by funding from the National Cancer Institute (NCI), National Institutes of Health (NIH) (award U01 CA167551). Support for case ascertainment was provided in part from the Surveillance, Epidemiology, and End Results (SEER) Program and the following U.S. state cancer registries: AZ, CO, MN, NC, NH; and by the Victoria Cancer Registry (Australia) and Ontario Cancer Registry (Canada). The CCFR Set‐1 (Illumina 1 M/1 M‐Duo) and Set‐2 (Illumina Omni1‐Quad) scans were supported by NIH awards U01 CA122839 and R01 CA143237 (to GC). The CCFR Set‐3 (Affymetrix Axiom CORECT Set array) was supported by NIH award U19 CA148107 and R01 CA81488 (to SBG). The CCFR Set‐4 (Illumina OncoArray 600 K SNP array) was supported by NIH award U19 CA148107 (to SBG) and by the Center for Inherited Disease Research (CIDR), which is funded by the NIH to the Johns Hopkins University, contract number HHSN268201200008I. Additional funding for the OFCCR/ARCTIC was through award GL201‐043 from the Ontario Research Fund (to BWZ), award 112746 from the Canadian Institutes of Health Research (to TJH), through a Cancer Risk Evaluation (CaRE) Program grant from the Canadian Cancer Society (to SG), and through generous support from the Ontario Ministry of Research and Innovation. The SFCCR Illumina HumanCytoSNP array was supported in part through NCI/NIH awards U01/U24 CA074794 and R01 CA076366 (to PAN). The content of this manuscript does not necessarily reflect the views or policies of the NCI, NIH or any of the collaborating centers in the Colon Cancer Family Registry (CCFR), nor does mention of trade names, commercial products or organizations imply endorsement by the US Government, any cancer registry or the CCFR.
COLON: The COLON study is sponsored by Wereld Kanker Onderzoek Fonds, including funds from grant 2014/1179 as part of the World Cancer Research Fund International Regular Grant Programme, by Alpe d'Huzes and the Dutch Cancer Society (UM 2012–5653, UW 2013–5927 and UW2015‐7946), and by TRANSCAN (JTC2012‐MetaboCCC and JTC2013‐FOCUS). The Nqplus study is sponsored by a ZonMW investment grant (98–10030); by PREVIEW, the project PREVention of diabetes through lifestyle intervention and population studies in Europe and around the World (PREVIEW) project which received funding from the European Union Seventh Framework Programme (FP7/2007–2013) under grant no. 312057; by funds from TI Food and Nutrition (cardiovascular health theme), a public–private partnership on precompetitive research in food and nutrition; and by FOODBALL, the Food Biomarker Alliance, a project from JPI Healthy Diet for a Healthy Life.
Colorectal Cancer Transdisciplinary (CORECT) Study: The CORECT Study was supported by the National Cancer Institute, National Institutes of Health (NCI/NIH), U.S. Department of Health and Human Services (grant numbers U19 CA148107, R01 CA081488, P30 CA014089, R01 CA197350; P01 CA196569; R01 CA201407; R01 CA242218), National Institutes of Environmental Health Sciences, National Institutes of Health (grant number T32 ES013678) and a generous gift from Daniel and Maryann Fong.
CORSA: The CORSA study was funded by Austrian Research Funding Agency (FFG) BRIDGE (grant 829675, to Andrea Gsur), the “Herzfelder'sche Familienstiftung” (grant to Andrea Gsur) and was supported by COST Action BM1206.
CPS‐II: The American Cancer Society funds the creation, maintenance and updating of the Cancer Prevention Study‐II (CPS‐II) cohort. The study protocol was approved by the institutional review boards of Emory University, and those of participating registries as required.
CRCGEN: Colorectal Cancer Genetics & Genomics, Spanish study was supported by Instituto de Salud Carlos III, co‐funded by FEDER funds—a way to build Europe—(grants PI14‐613 and PI09‐1286), Agency for Management of University and Research Grants (AGAUR) of the Catalan Government (grant 2017SGR723), Junta de Castilla y León (grant LE22A10–2), the Spanish Association Against Cancer (AECC) Scientific Foundation grant GCTRA18022MORE and the Consortium for Biomedical Research in Epidemiology and Public Health (CIBERESP), action Genrisk. Sample collection of this work was supported by the Xarxa de Bancs de Tumours de Catalunya sponsored by Pla Director d'Oncología de Catalunya (XBTC), Plataforma Biobancos PT13/0010/0013 and ICOBIOBANC, sponsored by the Catalan Institute of Oncology. We thank CERCA Programme, Generalitat de Catalunya for institutional support.
Czech Republic CCS: This work was supported by the Czech Science Foundation (21‐04607X, 21‐27902S), the Grant Agency of the Ministry of Health of the Czech Republic (grants AZV NU21‐07‐00247 and AZV NU21‐03‐00145) and Charles University Research Fund (Cooperation 43‐Surgical disciplines).
DACHS: This work was supported by the German Research Council (BR 1704/6–1, BR 1704/6–3, BR 1704/6–4, CH 117/1–1, HO 5117/2–1, HE 5998/2–1, KL 2354/3–1, RO 2270/8–1 and BR 1704/17–1), the Interdisciplinary Research Program of the National Center for Tumor Diseases (NCT), Germany, and the German Federal Ministry of Education and Research (01KH0404, 01ER0814, 01ER0815, 01ER1505A and 01ER1505B).
DALS: National Institutes of Health (R01 CA048998 to M. L. Slattery).
EDRN: This work is funded and supported by the NCI, EDRN Grant (U01‐CA152753).
EPIC: The coordination of EPIC is financially supported by International Agency for Research on Cancer (IARC) and also by the Department of Epidemiology and Biostatistics, School of Public Health, Imperial College London which has additional infrastructure support provided by the NIHR Imperial Biomedical Research Centre (BRC). The national cohorts are supported by Danish Cancer Society (Denmark); Ligue Contre le Cancer, Institut Gustave Roussy, Mutuelle Générale de l'Education Nationale and Institut National de la Santé et de la Recherche Médicale (INSERM) (France); German Cancer Aid, German Cancer Research Center (DKFZ), German Institute of Human Nutrition Potsdam‐ Rehbruecke (DIfE) and Federal Ministry of Education and Research (BMBF) (Germany); Associazione Italiana per la Ricerca sul Cancro‐AIRC‐Italy, Compagnia di SanPaolo and National Research Council (Italy); Dutch Ministry of Public Health, Welfare and Sports (VWS), Netherlands Cancer Registry (NKR), LK Research Funds, Dutch Prevention Funds, Dutch ZON (Zorg Onderzoek Nederland), World Cancer Research Fund (WCRF) and Statistics Netherlands (The Netherlands); Health Research Fund (FIS) ‐ Instituto de Salud Carlos III (ISCIII), Regional Governments of Andalucía, Asturias, Basque Country, Murcia and Navarra and the Catalan Institute of Oncology ‐ ICO (Spain); Swedish Cancer Society, Swedish Research Council and and Region Skåne and Region Västerbotten (Sweden); Cancer Research UK (14136 to EPIC‐Norfolk; C8221/A29017 to EPIC‐Oxford), Medical Research Council (1000143 to EPIC‐Norfolk; MR/M012190/1 to EPIC‐Oxford). (United Kingdom).
EPICOLON: This work was supported by grants from Fondo de Investigación Sanitaria/FEDER (PI08/0024, PI08/1276, PS09/02368, P111/00219, PI11/00681, PI14/00173, PI14/00230, PI17/00509, 17/00878, PI20/00113, PI20/00226, Acción Transversal de Cáncer), Xunta de Galicia (PGIDIT07PXIB9101209PR), Ministerio de Economia y Competitividad (SAF07‐64873, SAF 2010–19273, SAF2014‐54453R), Fundación Científica de la Asociación Española contra el Cáncer (GCB13131592CAST), Beca Grupo de Trabajo “Oncología” AEG (Asociación Española de Gastroenterología), Fundación Privada Olga Torres, FP7 CHIBCHA Consortium, Agència de Gestió d'Ajuts Universitaris i de Recerca (AGAUR, Generalitat de Catalunya, 2014SGR135, 2014SGR255, 2017SGR21, 2017SGR653), Catalan Tumour Bank Network (Pla Director d'Oncologia, Generalitat de Catalunya), PERIS (SLT002/16/00398, Generalitat de Catalunya), CERCA Programme (Generalitat de Catalunya) and COST Action BM1206 and CA17118. CIBERehd is funded by the Instituto de Salud Carlos III.
ESTHER/VERDI. This work was supported by grants from the Baden‐Württemberg Ministry of Science, Research and Arts and the German Cancer Aid.
Harvard cohorts: HPFS is supported by the National Institutes of Health (P01 CA055075, UM1 CA167552, U01 CA167552, R01 CA137178, R01 CA151993 and R35 CA197735), NHS by the National Institutes of Health (P01 CA087969, UM1 CA186107, R01 CA137178, R01 CA151993 and R35 CA197735) and PHS by the National Institutes of Health (R01 CA042182).
Hawaii Adenoma Study: NCI grants R01 CA072520.
HCES‐CRC: the Hwasun Cancer Epidemiology Study–Colon and Rectum Cancer (HCES‐CRC; grants from Chonnam National University Hwasun Hospital, HCRI15011‐1).
Kentucky: This work was supported by the following grant support: Clinical Investigator Award from Damon Runyon Cancer Research Foundation (CI‐8); NCI R01CA136726.
LCCS: The Leeds Colorectal Cancer Study was funded by the Food Standards Agency and Cancer Research UK Programme Award (C588/A19167).
MCCS cohort recruitment was funded by VicHealth and Cancer Council Victoria. The MCCS was further supported by Australian NHMRC grants 509348, 209057, 251553 and 504711 and by infrastructure provided by Cancer Council Victoria. Cases and their vital status were ascertained through the Victorian Cancer Registry (VCR) and the Australian Institute of Health and Welfare (AIHW), including the National Death Index and the Australian Cancer Database. BMLynch was supported by MCRF18005 from the Victorian Cancer Agency.
MEC: National Institutes of Health (R37 CA054281, P01 CA033619 and R01 CA063464).
MECC: This work was supported by the National Institutes of Health, U.S. Department of Health and Human Services (R01 CA081488, R01 CA197350, U19 CA148107, R01 CA242218) and a generous gift from Daniel and Maryann Fong.
MSKCC: The work at Sloan Kettering in New York was supported by the Robert and Kate Niehaus Center for Inherited Cancer Genomics and the Romeo Milio Foundation. Moffitt: This work was supported by funding from the National Institutes of Health (grant numbers R01 CA189184 and P30 CA076292), Florida Department of Health Bankhead‐Coley Grant 09BN‐13, and the University of South Florida Oehler Foundation. Moffitt contributions were supported in part by the Total Cancer Care Initiative, Collaborative Data Services Core and Tissue Core at the H. Lee Moffitt Cancer Center & Research Institute, a National Cancer Institute‐designated Comprehensive Cancer Center (grant number P30 CA076292).
NCCCS I & II: We acknowledge funding support for this project from the National Institutes of Health, R01 CA066635 and P30 DK034987.
NFCCR: This work was supported by an Interdisciplinary Health Research Team award from the Canadian Institutes of Health Research (CRT 43821); the National Institutes of Health, U.S. Department of Health and Human Serivces (U01 CA074783); and National Cancer Institute of Canada grants (18223 and 18226). The authors wish to acknowledge the contribution of Alexandre Belisle and the genotyping team of the McGill University and Génome Québec Innovation Centre, Montréal, Canada, for genotyping the Sequenom panel in the NFCCR samples. Funding was provided to Michael O. Woods by the Canadian Cancer Society Research Institute.
NSHDS: The research was supported by Biobank Sweden through funding from the Swedish Research Council (VR 2017–00650 and VR 2017–01737), the Swedish Cancer Society (CAN 2017/581), Region Västerbotten (VLL‐841671 and VLL‐833291), Knut and Alice Wallenberg Foundation (VLL‐765961) and the Lion's Cancer Research Foundation (several grants) and Insamlingsstiftelsen, both at Umeå University.
OSUMC: OCCPI funding was provided by Pelotonia and HNPCC funding was provided by the NCI (CA016058 and CA067941).
PLCO: Intramural Research Program of the Division of Cancer Epidemiology and Genetics and supported by contracts from the Division of Cancer Prevention, National Cancer Institute, NIH, DHHS. Funding was provided by National Institutes of Health (NIH), Genes, Environment and Health Initiative (GEI) Z01 CP 010200, NIH U01 HG004446 and NIH GEI U01 HG 004438.
SEARCH: The University of Cambridge has received salary support in respect of PDPP from the NHS in the East of England through the Clinical Academic Reserve. Cancer Research UK (C490/A16561); the UK National Institute for Health Research Biomedical Research Centres at the University of Cambridge.
SELECT: Research reported in this publication was supported in part by the National Cancer Institute of the National Institutes of Health under Award Numbers U10 CA037429 (CD Blanke), and UM1 CA182883 (CM Tangen/IM Thompson). The content is solely the responsibility of the authors and does not necessarily represent the official views of the National Institutes of Health.
SMS and REACH: This work was supported by the National Cancer Institute (grant P01 CA074184 to J.D.P. and P.A.N., grants R01 CA097325, R03 CA153323 and K05 CA152715 to P.A.N.), and the National Center for Advancing Translational Sciences at the National Institutes of Health (grant KL2 TR000421 to A.N.B.‐H.).
The Swedish Low‐risk Colorectal Cancer Study: The study was supported by grants from the Swedish research council; K2015‐55X‐22674‐01‐4, K2008‐55X‐20157‐03‐3, K2006‐72X‐20157‐01‐2 and the Stockholm County Council (ALF project).
Swedish Mammography Cohort and Cohort of Swedish Men: This work is supported by the Swedish Research Council /Infrastructure grant, the Swedish Cancer Foundation and the Karolinska Institute's Distinguished Professor Award to Alicja Wolk.
UK Biobank: This research has been conducted using the UK Biobank Resource under Application Number 8614.
VITAL: National Institutes of Health (K05 CA154337).
WHI: The WHI program is funded by the National Heart, Lung, and Blood Institute, National Institutes of Health, U.S. Department of Health and Human Services through contracts 75N92021D00001, 75N92021D00002, 75N92021D00003, 75N92021D00004 and 75N92021D00005.
The funders had no role in the design of the study; the collection, analysis and interpretation of the data; the writing of the manuscript; or the decision to submit the manuscript for publication.
CONFLICT OF INTEREST STATEMENT
The authors report no conflicts of interest.
Supporting information
Figure S1. Sex‐specific colorectal cancer results.
Data S1. Tables.
Data S2. Supporting Information.
ACKNOWLEDGEMENTS
ASTERISK: We are very grateful to those without whom this project would not have existed. We also thank all those who agreed to participate in this study, including the patients and the healthy control persons, as well as all the physicians, technicians and students.
CCFR: The Colon CFR graciously thanks the generous contributions of their study participants, dedication of study staff, and the financial support from the U.S. National Cancer Institute, without which this important registry would not exist. The authors would like to thank the study participants and staff of the Seattle Colon Cancer Family Registry and the Hormones and Colon Cancer study (CORE Studies).
CLUE II: We thank the participants of Clue II and appreciate the continued efforts of the staff at the Johns Hopkins George W. Comstock Center for Public Health Research and Prevention in the conduct of the Clue II Cohort Study. Cancer data was provided by the Maryland Cancer Registry, Center for Cancer Prevention and Control, Maryland Department of Health, with funding from the State of Maryland and the Maryland Cigarette Restitution Fund. The collection and availability of cancer registry data is also supported by the Cooperative Agreement NU58DP006333, funded by the Centers for Disease Control and Prevention. Its contents are solely the responsibility of the authors and do not necessarily represent the official views of the Centers for Disease Control and Prevention or the Department of Health and Human Services.
COLON and NQplus: the authors would like to thank the COLON and NQplus investigators at Wageningen University & Research and the involved clinicians in the participating hospitals.
CORSA: We kindly thank all individuals who agreed to participate in the CORSA study. Furthermore, we thank all cooperating physicians and students and the Biobank Graz of the Medical University of Graz.
CPS‐II: The authors express sincere appreciation to all Cancer Prevention Study‐II participants, and to each member of the study and biospecimen management group. The authors would like to acknowledge the contribution to this study from central cancer registries supported through the Centers for Disease Control and Prevention's National Program of Cancer Registries and cancer registries supported by the National Cancer Institute's Surveillance Epidemiology and End Results Program. The authors assume full responsibility for all analyses and interpretation of results. The views expressed here are those of the authors and do not necessarily represent the American Cancer Society or the American Cancer Society – Cancer Action Network.
Czech Republic CCS: We are thankful to all clinicians in major hospitals in the Czech Republic, without whom the study would not be practicable. We are also sincerely grateful to all patients participating in this study.
DACHS: We thank all participants and cooperating clinicians, and everyone who provided excellent technical assistance.
EDRN: We acknowledge all contributors to the development of the resource at University of Pittsburgh School of Medicine, Department of Gastroenterology, Department of Pathology, Hepatology and Nutrition and Biomedical Informatics.
EPIC: Where authors are identified as personnel of the International Agency for Research on Cancer/World Health Organization, the authors alone are responsible for the views expressed in this article and they do not necessarily represent the decisions, policy or views of the International Agency for Research on Cancer/World Health Organization.
EPICOLON: We are sincerely grateful to all patients participating in this study who were recruited as part of the EPICOLON project. We acknowledge the Spanish National DNA Bank, Biobank of Hospital Clínic–IDIBAPS and Biobanco Vasco for the availability of the samples. The work was carried out (in part) at the Esther Koplowitz Centre, Barcelona.
Harvard cohorts: The study protocol was approved by the institutional review boards of the Brigham and Women's Hospital and Harvard T.H. Chan School of Public Health, and those of participating registries as required. We acknowledge Channing Division of Network Medicine, Department of Medicine, Brigham and Women's Hospital as home of the NHS. The authors would like to acknowledge the contribution to this study from central cancer registries supported through the Centers for Disease Control and Prevention's National Program of Cancer Registries (NPCR) and/or the National Cancer Institute's Surveillance, Epidemiology, and End Results (SEER) Program. Central registries may also be supported by state agencies, universities, and cancer centers. Participating central cancer registries include the following: Alabama, Alaska, Arizona, Arkansas, California, Colorado, Connecticut, Delaware, Florida, Georgia, Hawaii, Idaho, Indiana, Iowa, Kentucky, Louisiana, Massachusetts, Maine, Maryland, Michigan, Mississippi, Montana, Nebraska, Nevada, New Hampshire, New Jersey, New Mexico, New York, North Carolina, North Dakota, Ohio, Oklahoma, Oregon, Pennsylvania, Puerto Rico, Rhode Island, Seattle SEER Registry, South Carolina, Tennessee, Texas, Utah, Virginia, West Virginia, Wyoming. The authors assume full responsibility for analyses and interpretation of these data.
Kentucky: We would like to acknowledge the staff at the Kentucky Cancer Registry.
LCCS: We acknowledge the contributions of Jennifer Barrett, Robin Waxman, Gillian Smith and Emma Northwood in conducting this study.
NCCCS I & II: We would like to thank the study participants, and the NC Colorectal Cancer Study staff.
NSHDS investigators thank the Västerbotten Intervention Programme, the Northern Sweden MONICA study, the Biobank Research Unit at Umeå University and Biobanken Norr at Region Västerbotten for providing data and samples and acknowledge the contribution from Biobank Sweden, supported by the Swedish Research Council.
PLCO: The authors thank the PLCO Cancer Screening Trial screening center investigators and the staff from Information Management Services Inc. and Westat Inc. Most importantly, we thank the study participants for their contributions that made this study possible.
Cancer incidence data have been provided by the District of Columbia Cancer Registry, Georgia Cancer Registry, Hawaii Cancer Registry, Minnesota Cancer Surveillance System, Missouri Cancer Registry, Nevada Central Cancer Registry, Pennsylvania Cancer Registry, Texas Cancer Registry, Virginia Cancer Registry, and Wisconsin Cancer Reporting System. All are supported in part by funds from the Center for Disease Control and Prevention, National Program for Central Registries, local states or by the National Cancer Institute, Surveillance, Epidemiology, and End Results program. The results reported here and the conclusions derived are the sole responsibility of the authors.
SEARCH: We thank the SEARCH team.
SELECT: We thank the research and clinical staff at the sites that participated on SELECT study, without whom the trial would not have been successful. We are also grateful to the 35,533 dedicated men who participated in SELECT.
WHI: The authors thank the WHI investigators and staff for their dedication, and the study participants for making the program possible. A full listing of WHI investigators can be found at: https://s3‐us‐west‐2.amazonaws.com/www‐whi‐org/wp‐content/uploads/WHI‐Investigator‐Long‐List.pdf.
We want to acknowledge the participants and investigators of the FinnGen study.
Papadimitriou N, Murphy N, Jenab M, et al. Body mass index at birth and early life and colorectal cancer: A two‐sample Mendelian randomization analysis in European and East Asian genetic similarity populations. Pediatric Obesity. 2025;20(1):e13186. doi: 10.1111/ijpo.13186
Where authors are identified as personnel of the International Agency for Research on Cancer/World Health Organization, the authors alone are responsible for the views expressed in this article and they do not necessarily represent the decisions, policy or views of the International Agency for Research on Cancer/World Health Organization. This article is the result of the scientific work of Dr. Murphy while he was affiliated at IARC.
DATA AVAILABILITY STATEMENT
The necessary data to replicate our MR analysis are included in the supplementary material.
REFERENCES
- 1. Collaborators GBDO, Afshin A, Forouzanfar MH, et al. Health effects of overweight and obesity in 195 countries over 25 years. N Engl J Med. 2017;377(1):13‐27. [DOI] [PMC free article] [PubMed] [Google Scholar]
- 2. Bibbins‐Domingo K, Coxson P, Pletcher MJ, Lightwood J, Goldman L. Adolescent overweight and future adult coronary heart disease. N Engl J Med. 2007;357(23):2371‐2379. [DOI] [PubMed] [Google Scholar]
- 3. Hannon TS, Rao G, Arslanian SA. Childhood obesity and type 2 diabetes mellitus. Pediatrics. 2005;116(2):473‐480. [DOI] [PubMed] [Google Scholar]
- 4. Xue F, Rosner B, Eliassen H, Michels KB. Body fatness throughout the life course and the incidence of premenopausal breast cancer. Int J Epidemiol. 2016;45(4):1103‐1112. [DOI] [PMC free article] [PubMed] [Google Scholar]
- 5. Sung H, Ferlay J, Siegel RL, et al. Global cancer statistics 2020: GLOBOCAN estimates of incidence and mortality worldwide for 36 cancers in 185 countries. CA Cancer J Clin. 2021;71(3):209‐249. [DOI] [PubMed] [Google Scholar]
- 6. Wei EK, Wolin KY, Colditz GA. Time course of risk factors in cancer etiology and progression. J Clin Oncol. 2010;28(26):4052‐4057. [DOI] [PMC free article] [PubMed] [Google Scholar]
- 7. Biro FM, Wien M. Childhood obesity and adult morbidities. Am J Clin Nutr. 2010;91(5):1499S‐1505S. [DOI] [PMC free article] [PubMed] [Google Scholar]
- 8. Garcia H, Song M. Early‐life obesity and adulthood colorectal cancer risk: a meta‐analysis. Rev Panam Salud Publica. 2019;43:e3:1‐8. [DOI] [PMC free article] [PubMed] [Google Scholar]
- 9. Hidayat K, Yang CM, Shi BM. Body fatness at an early age and risk of colorectal cancer. Int J Cancer. 2018;142(4):729‐740. [DOI] [PubMed] [Google Scholar]
- 10. Davey Smith G, Ebrahim S. Epidemiology—is it time to call it a day? Int J Epidemiol. 2001;30(1):1‐11. [DOI] [PubMed] [Google Scholar]
- 11. Lawlor DA, Davey Smith G, Kundu D, Bruckdorfer KR, Ebrahim S. Those confounded vitamins: what can we learn from the differences between observational versus randomised trial evidence? Lancet. 2004;363(9422):1724‐1727. [DOI] [PubMed] [Google Scholar]
- 12. Smith GD, Ebrahim S. 'Mendelian randomization': can genetic epidemiology contribute to understanding environmental determinants of disease? Int J Epidemiol. 2003;32(1):1‐22. [DOI] [PubMed] [Google Scholar]
- 13. Lawlor DA, Harbord RM, Sterne JA, Timpson N, Davey SG. Mendelian randomization: using genes as instruments for making causal inferences in epidemiology. Stat Med. 2008;27(8):1133‐1163. [DOI] [PubMed] [Google Scholar]
- 14. Fang X, Wang X, Song Z, et al. Causal association of childhood obesity with cancer risk in adulthood: a mendelian randomization study. Int J Cancer. 2021;149(7):1421‐1425. [DOI] [PubMed] [Google Scholar]
- 15. Mariosa D, Smith‐Byrne K, Richardson TG, et al. Body size at different ages and risk of 6 cancers: a mendelian randomization and prospective cohort study. J Natl Cancer Inst. 2022;114(9):1296‐1300. [DOI] [PMC free article] [PubMed] [Google Scholar]
- 16. Papadimitriou N, Bull CJ, Jenab M, et al. Separating the effects of early and later life adiposity on colorectal cancer risk: a mendelian randomization study. BMC Med. 2023;21(1):5. [DOI] [PMC free article] [PubMed] [Google Scholar]
- 17. Helgeland O, Vaudel M, Sole‐Navais P, et al. Characterization of the genetic architecture of infant and early childhood body mass index. Nat Metab. 2022;4(3):344‐358. [DOI] [PubMed] [Google Scholar]
- 18. Huyghe JR, Bien SA, Harrison TA, et al. Discovery of common and rare genetic risk variants for colorectal cancer. Nat Genet. 2019;51(1):76‐87. [DOI] [PMC free article] [PubMed] [Google Scholar]
- 19. Kurki MI, Karjalainen J, Palta P, et al. FinnGen provides genetic insights from a well‐phenotyped isolated population. Nature. 2023;613(7944):508‐518. [DOI] [PMC free article] [PubMed] [Google Scholar]
- 20. Fernandez‐Rozadilla C, Timofeeva M, Chen Z, et al. Deciphering colorectal cancer genetics through multi‐omic analysis of 100,204 cases and 154,587 controls of European and east Asian ancestries. Nat Genet. 2023;55(1):89‐99. [DOI] [PMC free article] [PubMed] [Google Scholar]
- 21. Lu Y, Kweon SS, Tanikawa C, et al. Large‐scale genome‐wide association study of east Asians identifies loci associated with risk for colorectal cancer. Gastroenterology. 2019;156(5):1455‐1466. [DOI] [PMC free article] [PubMed] [Google Scholar]
- 22. Lu Y, Kweon SS, Cai Q, et al. Identification of novel loci and new risk variant in known loci for colorectal cancer risk in east Asians. Cancer Epidemiol Biomarkers Prev. 2020;29(2):477‐486. [DOI] [PMC free article] [PubMed] [Google Scholar]
- 23. Higgins JP, Thompson SG, Deeks JJ, Altman DG. Measuring inconsistency in meta‐analyses. BMJ. 2003;327(7414):557‐560. [DOI] [PMC free article] [PubMed] [Google Scholar]
- 24. Bowden J, del Greco MF, Minelli C, Davey Smith G, Sheehan N, Thompson J. A framework for the investigation of pleiotropy in two‐sample summary data mendelian randomization. Stat Med. 2017;36(11):1783‐1802. [DOI] [PMC free article] [PubMed] [Google Scholar]
- 25. Bowden J, Davey Smith G, Burgess S. Mendelian randomization with invalid instruments: effect estimation and bias detection through egger regression. Int J Epidemiol. 2015;44(2):512‐525. [DOI] [PMC free article] [PubMed] [Google Scholar]
- 26. Burgess S, Thompson SG. Interpreting findings from mendelian randomization using the MR‐egger method. Eur J Epidemiol. 2017;32(5):377‐389. [DOI] [PMC free article] [PubMed] [Google Scholar]
- 27. Bowden J, del Greco MF, Minelli C, Davey Smith G, Sheehan NA, Thompson JR. Assessing the suitability of summary data for two‐sample mendelian randomization analyses using MR‐egger regression: the role of the I2 statistic. Int J Epidemiol. 2016;45(6):1961‐1974. [DOI] [PMC free article] [PubMed] [Google Scholar]
- 28. Bowden J, Davey Smith G, Haycock PC, Burgess S. Consistent estimation in mendelian randomization with some invalid instruments using a weighted median estimator. Genet Epidemiol. 2016;40(4):304‐314. [DOI] [PMC free article] [PubMed] [Google Scholar]
- 29. Verbanck M, Chen CY, Neale B, Do R. Detection of widespread horizontal pleiotropy in causal relationships inferred from mendelian randomization between complex traits and diseases. Nat Genet. 2018;50(5):693‐698. [DOI] [PMC free article] [PubMed] [Google Scholar]
- 30. Brion MJ, Shakhbazov K, Visscher PM. Calculating statistical power in mendelian randomization studies. Int J Epidemiol. 2013;42(5):1497‐1501. [DOI] [PMC free article] [PubMed] [Google Scholar]
- 31. Higgins JP, Thompson SG. Quantifying heterogeneity in a meta‐analysis. Stat Med. 2002;21(11):1539‐1558. [DOI] [PubMed] [Google Scholar]
- 32. Felix JF, Bradfield JP, Monnereau C, et al. Genome‐wide association analysis identifies three new susceptibility loci for childhood body mass index. Hum Mol Genet. 2016;25(2):389‐403. [DOI] [PMC free article] [PubMed] [Google Scholar]
- 33. Levi Z, Kark JD, Katz LH, et al. Adolescent body mass index and risk of colon and rectal cancer in a cohort of 1.79 million Israeli men and women: a population‐based study. Cancer. 2017;123(20):4022‐4030. [DOI] [PubMed] [Google Scholar]
- 34. Suzuki S, Goto A, Nakatochi M, et al. Body mass index and colorectal cancer risk: a mendelian randomization study. Cancer Sci. 2021;112(4):1579‐1588. [DOI] [PMC free article] [PubMed] [Google Scholar]
- 35. Burgess S, Davies NM, Thompson SG. Bias due to participant overlap in two‐sample mendelian randomization. Genet Epidemiol. 2016;40(7):597‐608. [DOI] [PMC free article] [PubMed] [Google Scholar]
Associated Data
This section collects any data citations, data availability statements, or supplementary materials included in this article.
Supplementary Materials
Figure S1. Sex‐specific colorectal cancer results.
Data S1. Tables.
Data S2. Supporting Information.
Data Availability Statement
The necessary data to replicate our MR analysis are included in the supplementary material.