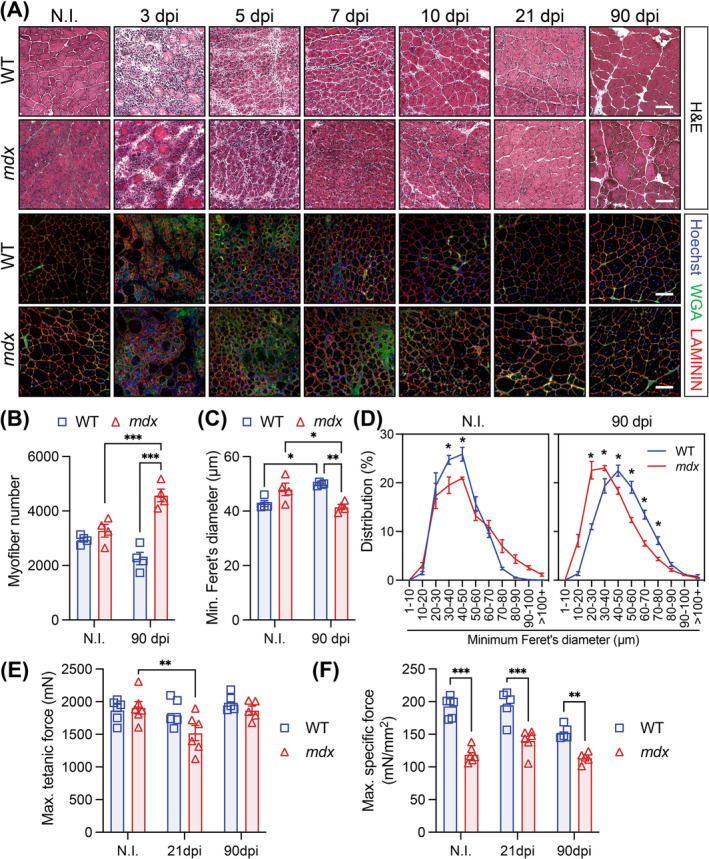
FIGURE 3.

Delayed regeneration of mdx muscle following acute injury. (A) Representative haematoxylin and eosin (H&E) and immunofluorescence images of transversal sections of non‐injured (NI) and cardiotoxin (CTX)‐injured tibialis anterior (TA) muscle at 3, 5, 7, 10, 21 and 90 days post‐injury (dpi) from wild‐type (WT) and mdx mice. LAMININ (red) delineates the myofibres, WGA (green) stains the connective tissues and Hoechst (blue) labels the nuclei. (B) Cross‐sectional TA myofibre quantification at 90 dpi compared to NI. (C) Mean WT and mdx TA myofibre size using the minimum Feret's diameter in NI and CTX‐injured muscles at 90 dpi. (D) Normalized TA myofibre size distribution using the minimum Feret's diameter. (E) Maximum tetanic force of TA muscle from NI, 21 and 90 dpi WT and mdx mice. (F) Maximum specific force of TA muscles from NI, 21 and 90 dpi WT and mdx mice. Scale bar, 100 μm. Data presented as mean values ± SEM. Two‐way ANOVA corrected for multiple comparisons using Sidak's test (*p < 0.05; **p < 0.01; ***p < 0.001). NI = non‐injured. For Panels B–D, n = 4 WT and 4 mdx ‘non‐injured’ mice, n = 5 WT and 5 mdx ‘90 dpi’ mice. For Panels E and F, n = 6 WT and 6 mdx ‘non‐injured’ mice, n = 5 WT and 6 mdx ‘21 dpi’ mice, n = 5 WT and 5 mdx ‘90 dpi’ mice.
