FIGURE 7.

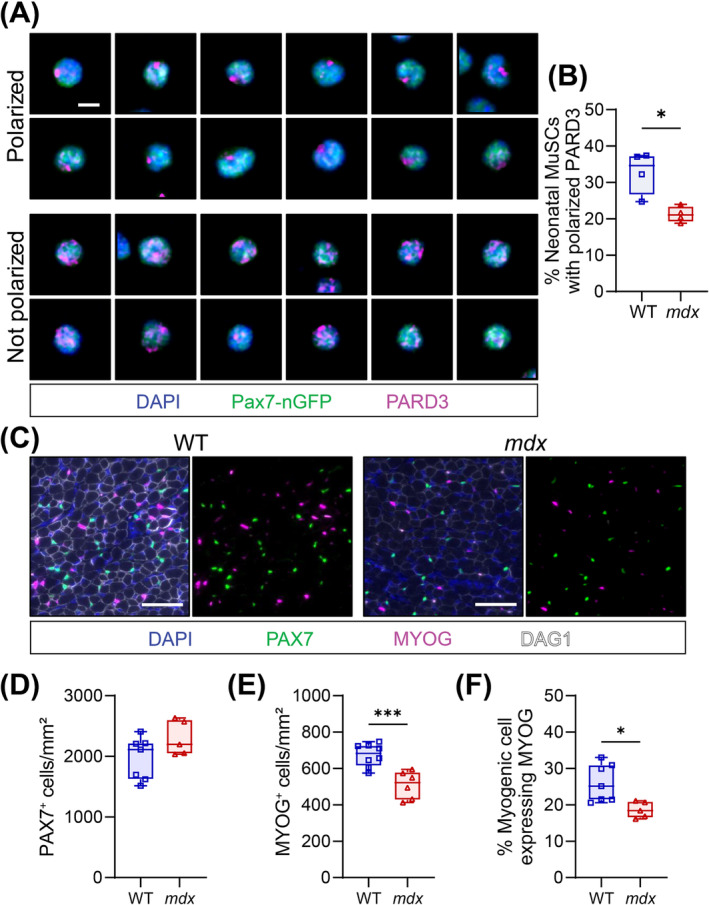
Reduced polarity and commitment of neonatal MuSCs. (A) Representative immunostaining of polarized and non‐polarized PARD3 (magenta) in MuSCs (Pax7‐nGFP, green) isolated from the limbs of neonatal day 7 mice. Scale bar, 5 μm. (B) Quantification of PARD3 polarization in neonatal MuSCs. An average of 536 cells quantified per replicate. (C) Example immunofluorescence image of neonatal day 7 WT and mdx hindlimb muscle transverse section. PAX7 (green) denotes the neonatal MuSCs, MYOG (magenta) stains the differentiated myogenic cells, DAG1 (white) labels the connective tissues, and DAPI (blue) labels the nuclei. Scale bar, 50 μm. (D,E) Enumeration of PAX7‐expressing (PAX7+) (D) and MYOG‐expressing (MYOG+) (E) cells on extensor digitorum longus (EDL) and tibialis anterior (TA) cross‐sections at neonatal day 7 and normalized to mm2. (F) MYOG+ cell proportion relative to total PAX7+ and MYOG+ myogenic cells at neonatal day 7. Boxplot whiskers represent the maximum and minimum data values. Statistical analysis performed using unpaired t‐tests where *p < 0.05; **p < 0.01; ***p < 0.001.
