FIGURE 8.

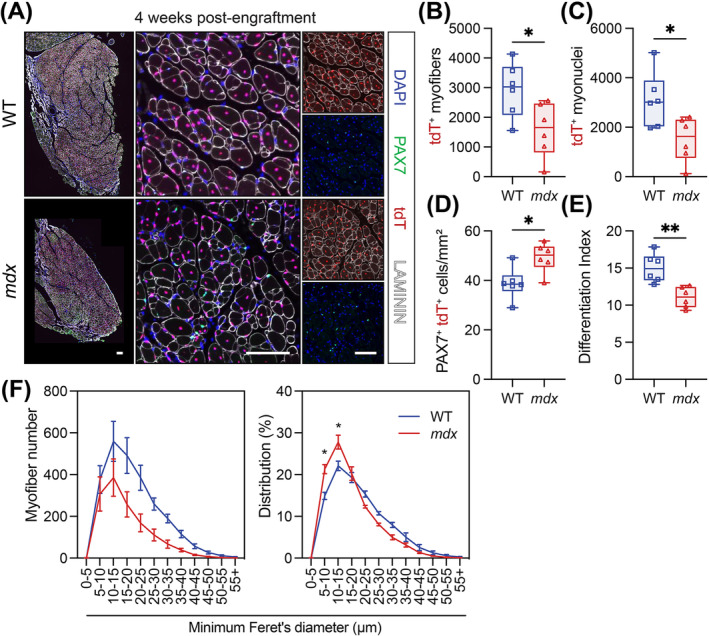
Intrinsic MuSC dysfunction impairs muscle regeneration. (A) Immunostaining of host tibialis anterior (TA) muscle cross‐sections 4 weeks following the engraftment of 10 000 MuSCs isolated from WT;ROSA‐nTnG or mdx; ROSA‐nTnG mice. Donor MuSCs (PAX7, green) and myonuclei express nuclear tdTomato (tdT, red). Laminin (white) stains myofibre basal lamina and DAPI (blue) stains the nuclei. Scale bars: left panels, 250 μm; middle and right panels, 100 μm. (B) Number of tdT+ myofibres per TA muscle transverse section. (C) Number of tdT+ myonuclei per TA cross‐section . (D) PAX7+/tdT+ MuSC number normalized to mm2 of transplanted muscle cross‐sections. (E) Differentiation index is the ratio of tdT+ myonuclei to tdT+ MuSCs. (F) Myofibre size distribution using minimum Feret's diameter and illustrated by number of myofibres (left) and proportional distribution (right). For B‐E, box plot whiskers indicate the maximum and minimum data values. For F, data presented as mean values ± SEM. Panels B–E: Statistical analysis performed using unpaired t‐tests. Panel F: Two‐way ANOVA corrected for multiple comparisons using Sidak's test. *p < 0.05; **p < 0.01; ***p < 0.001.
