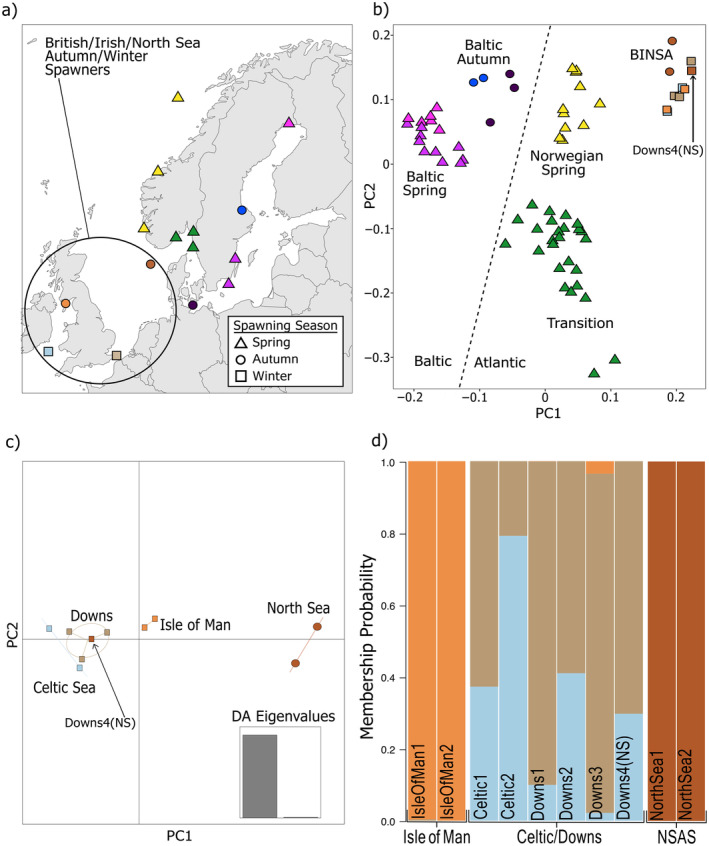
FIGURE 1.

Population structure in modern Atlantic herring is based on local adaptation. (a) Sampling locations for modern herring samples. Shapes correspond to spawning season; (b) herring are separated into metapopulations corresponding to adaptive phenotypes associated with spawning phenotype and local salinity levels. Samples are colored by sampling location (panel a) and shapes correspond to spawning season. PCA constructed with 10 million SNPs (non‐maf filtered) using smartPCA; (c) mixed‐stock analysis with the BINSA metapopulation shows substructuring between the North Sea, Isle of Man, and Celtic/Downs populations. This panel shows the results of DAPC analysis using two PCs; and (d) three subpopulations are indicated by DAPC analysis: North Sea, Isle of Man, and an admixed population between Celtic Sea and Downs based on 82 SNPs diagnostic SNPs designated for mixed‐stock analysis. Four populations were used as input priors: Celtic Sea, Downs, Isle of Man, and North Sea (NSAS). DAPC suggests there are three groups: Downs4(NS) was identified as an admixed Celtic Sea/Downs individual, not a North Sea individual as listed in public metadata. Samples are grouped based on genetic identity (labeled on x‐axis). Labels within bars refer to individual sample IDs. Map lines delineate study areas and do not necessarily depict accepted national boundaries.
