FIGURE 4.

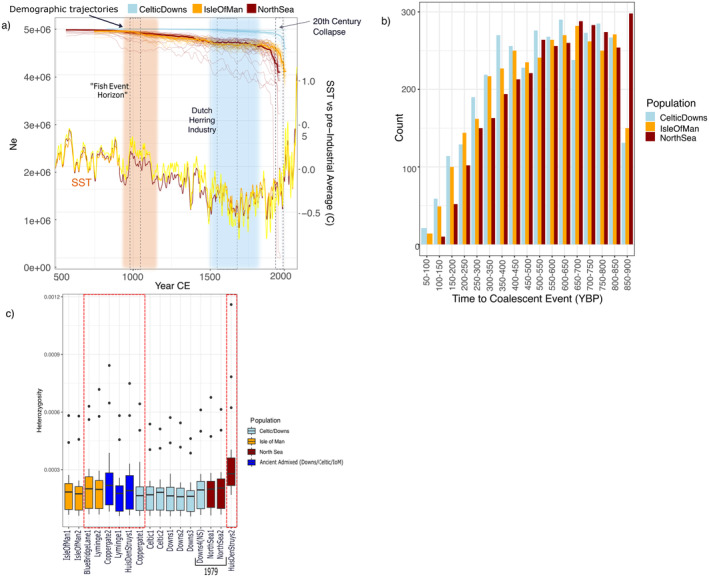
Genetic diversity and demographic change over time and space suggest recent population declines in exploited herring stocks. (a) N e reconstructions showing recent dramatic declines, with population declines beginning ~1000 CE for NSAS and Isle of Man. N e is estimated per population with GONE. Opaque lines represent median N e estimates from 30 iterations of GONE, with each iteration represented by semi‐transparent lines. Year was calculated by scaling generational N e estimates to generation times reported by Feng et al. (2017). Colored blocks represent the Medieval Climate Anomaly (orange) and Little Ice Age (blue). Hashed blocks represent historical events. Sea‐surface temperature (SST) reconstructions were adapted from three published indicators (Mann et al. 2009). (b) Number of ROHs associated with a coalescent event at a specific time period (calculated with the formula T = 100/2 × cM × Gen) per modern population. (c) Higher heterozygosity in ancient/historical samples (red hashed boxes) than 21st century samples. Heterozygosity was estimated per chromosome by individual using the site frequency spectrum. Samples are grouped according to site/basin of origin and boxplots are filled according to population assignment from MSA.
