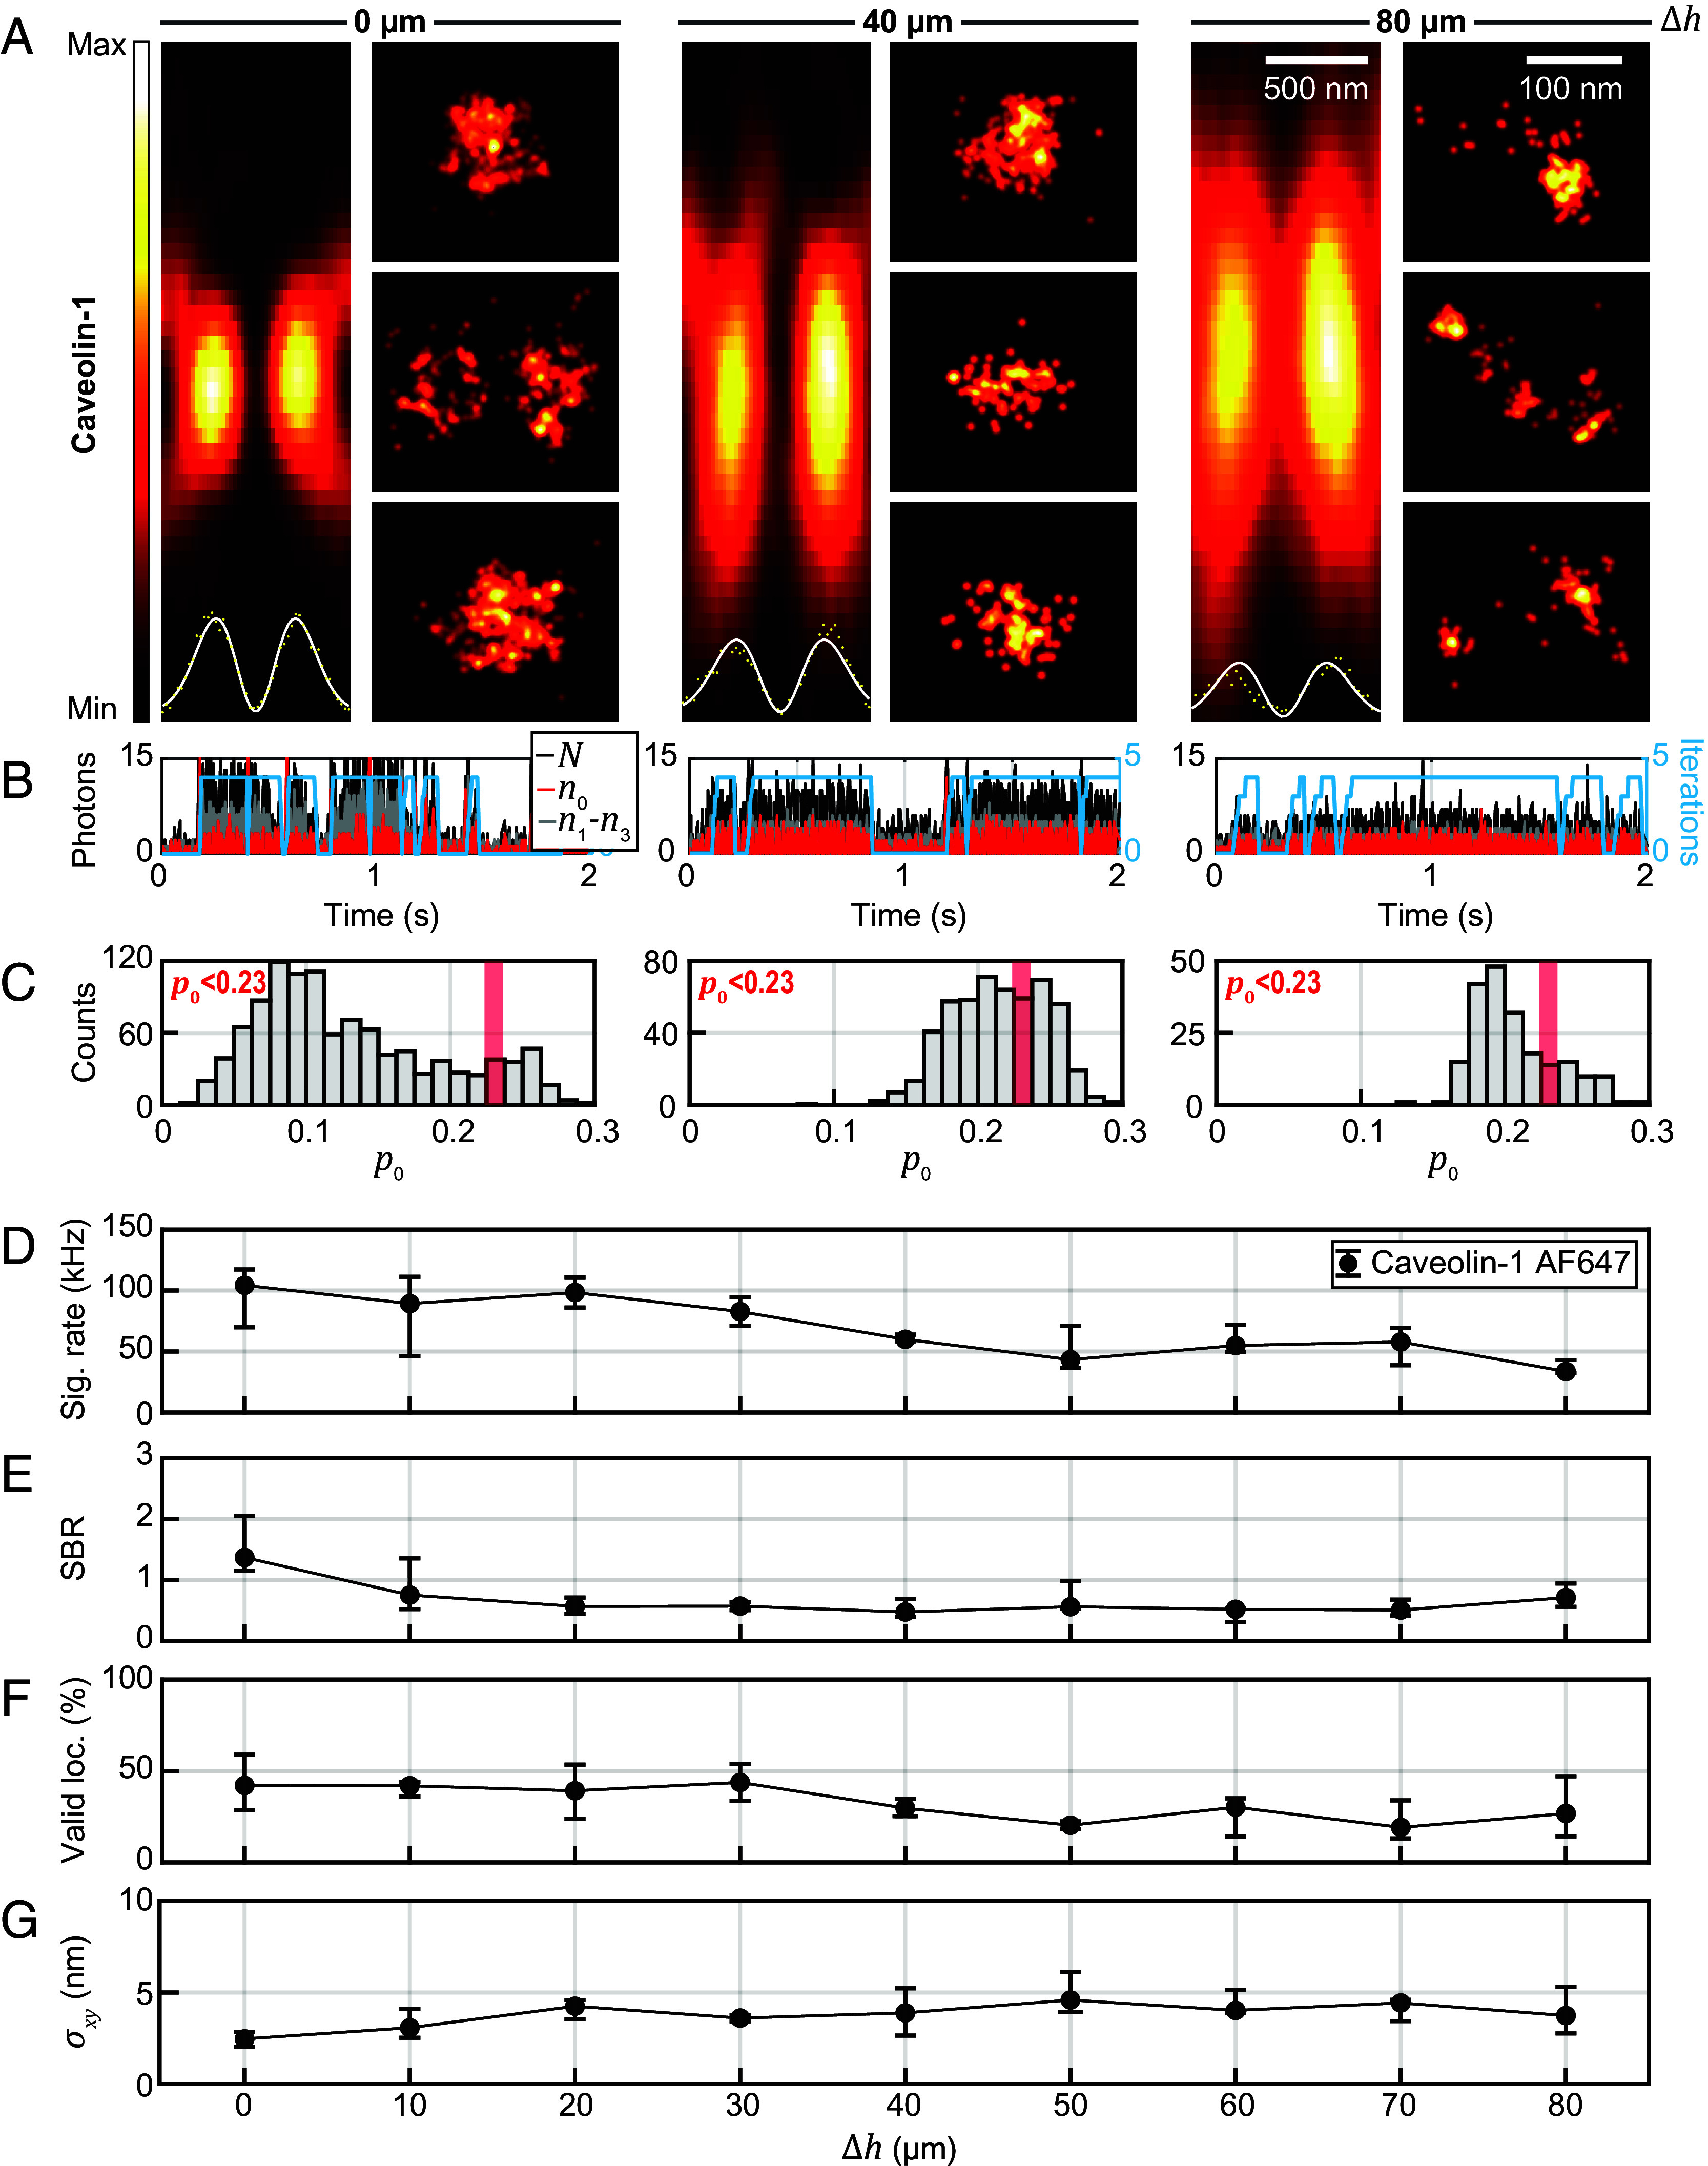
Fig. 3.

Imaging up to 80 µm deep in tissue with MINFLUX nanoscopy. (A) Focal intensity distribution (xz) of the excitation donut in different imaging depths in tissue, together with regions of interest from MINFLUX images in the same imaging depth showing Caveolin-1 distributions. Intensity profiles of the excitation light are shown as Insets together with a donut-shaped fit along the x-axis. The intensity minimum deteriorates from 3% at the coverslip to 14% in 80 µm depth. The FWHM of the focus along z is increased from ~900 nm at the coverslip to ~1,660 nm in 80 µm depth. (B) Photon traces for the upper row of MINFLUX images. (C) Histogram of values for resegmented localizations. (D) Median signal count rate and interquartile range in each imaging depth. (E) Median SBR over depth. (F) Median ratio of valid localizations over depth. (G) Median localization precision over depth. Statistics from 703,924 localizations (23 images) in ~0 µm, 58,303 locs. (9 images) in ~10 µm, 50,396 locs. (10 images) in ~20 µm, 10,051 locs. (2 images) in ~30 µm, 16,009 locs. (5 images) in ~40 µm, 53,764 locs. (5 images) in ~50 µm, 32,978 locs. (6 images) in 60 µm, 193,465 locs. (15 images) in 70 µm and 12,289 locs. (7 images) in ~80 µm imaging depth. Δh: imaging depth, N: number of photons collected in one multiplexing cycle. ni: number of photons in ith exposure, p0 = n0/N, σxy: localization precision, SBR: signal to background ratio.
