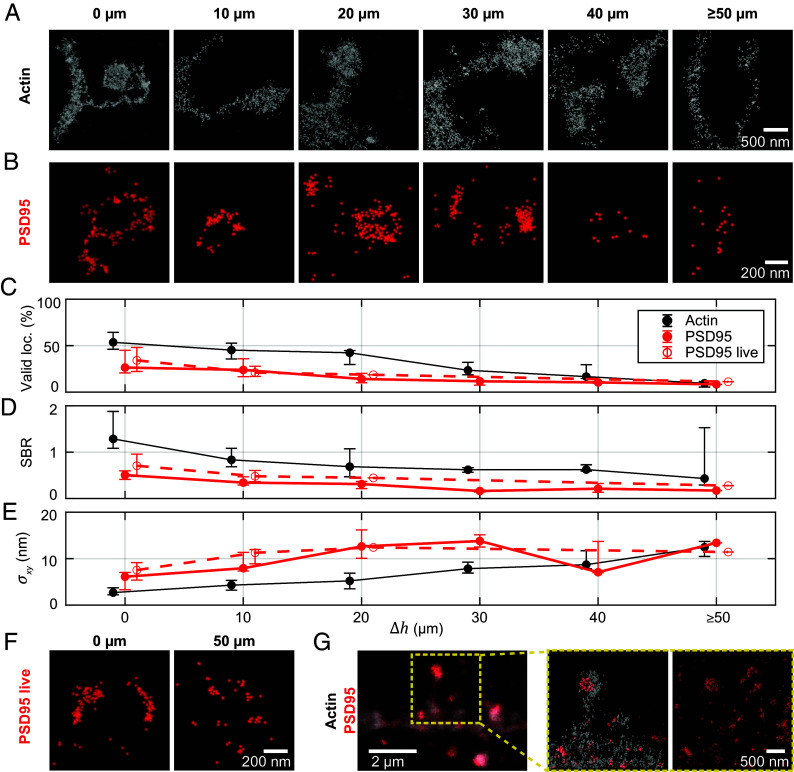
Fig. 4.
Imaging the post-synapse deep in tissue. (A) MINFLUX nanoscopy of actin (LifeAct-EYFP labeled with primary and secondary antibody by Alexa Fluor 647) in 0 to 50 µm imaging depth. Localizations classified by delineation (SI Appendix, Fig. S9) as not belonging to spine or dendrite are reduced in visibility. (B) PSD95-mEos2 in fixed tissue in 0 to 50 µm imaging depth. (C) Median percentage of valid MINFLUX localizations (p0 < 0.23) and interquartile range over imaging depth, calculated from several images in each imaging depth. (D) Median signal to background ratio vs. imaging depth. (E) Median localization precision vs. imaging depth. Number of localizations and images from which the statistics for the three different samples are calculated are shown in SI Appendix, Table S8. (F) PSD95-mEos2 in living tissue in 0 and 50 µm imaging depth. (G) Imaging with two excitation colors. Two-color image of PSD95-mEos2 and actin-AlexaFluor647. (Left to Right): Two-color confocal overview image. Two-excitation-color MINFLUX in the ROI showing the PSD95 distribution on the postsynapse (only delineated dendritic region shown); full image from the PSD95-mEos2 color channel; further confocal overview images from which the relevant fluorescence was identified are shown in SI Appendix, Fig. S11.

