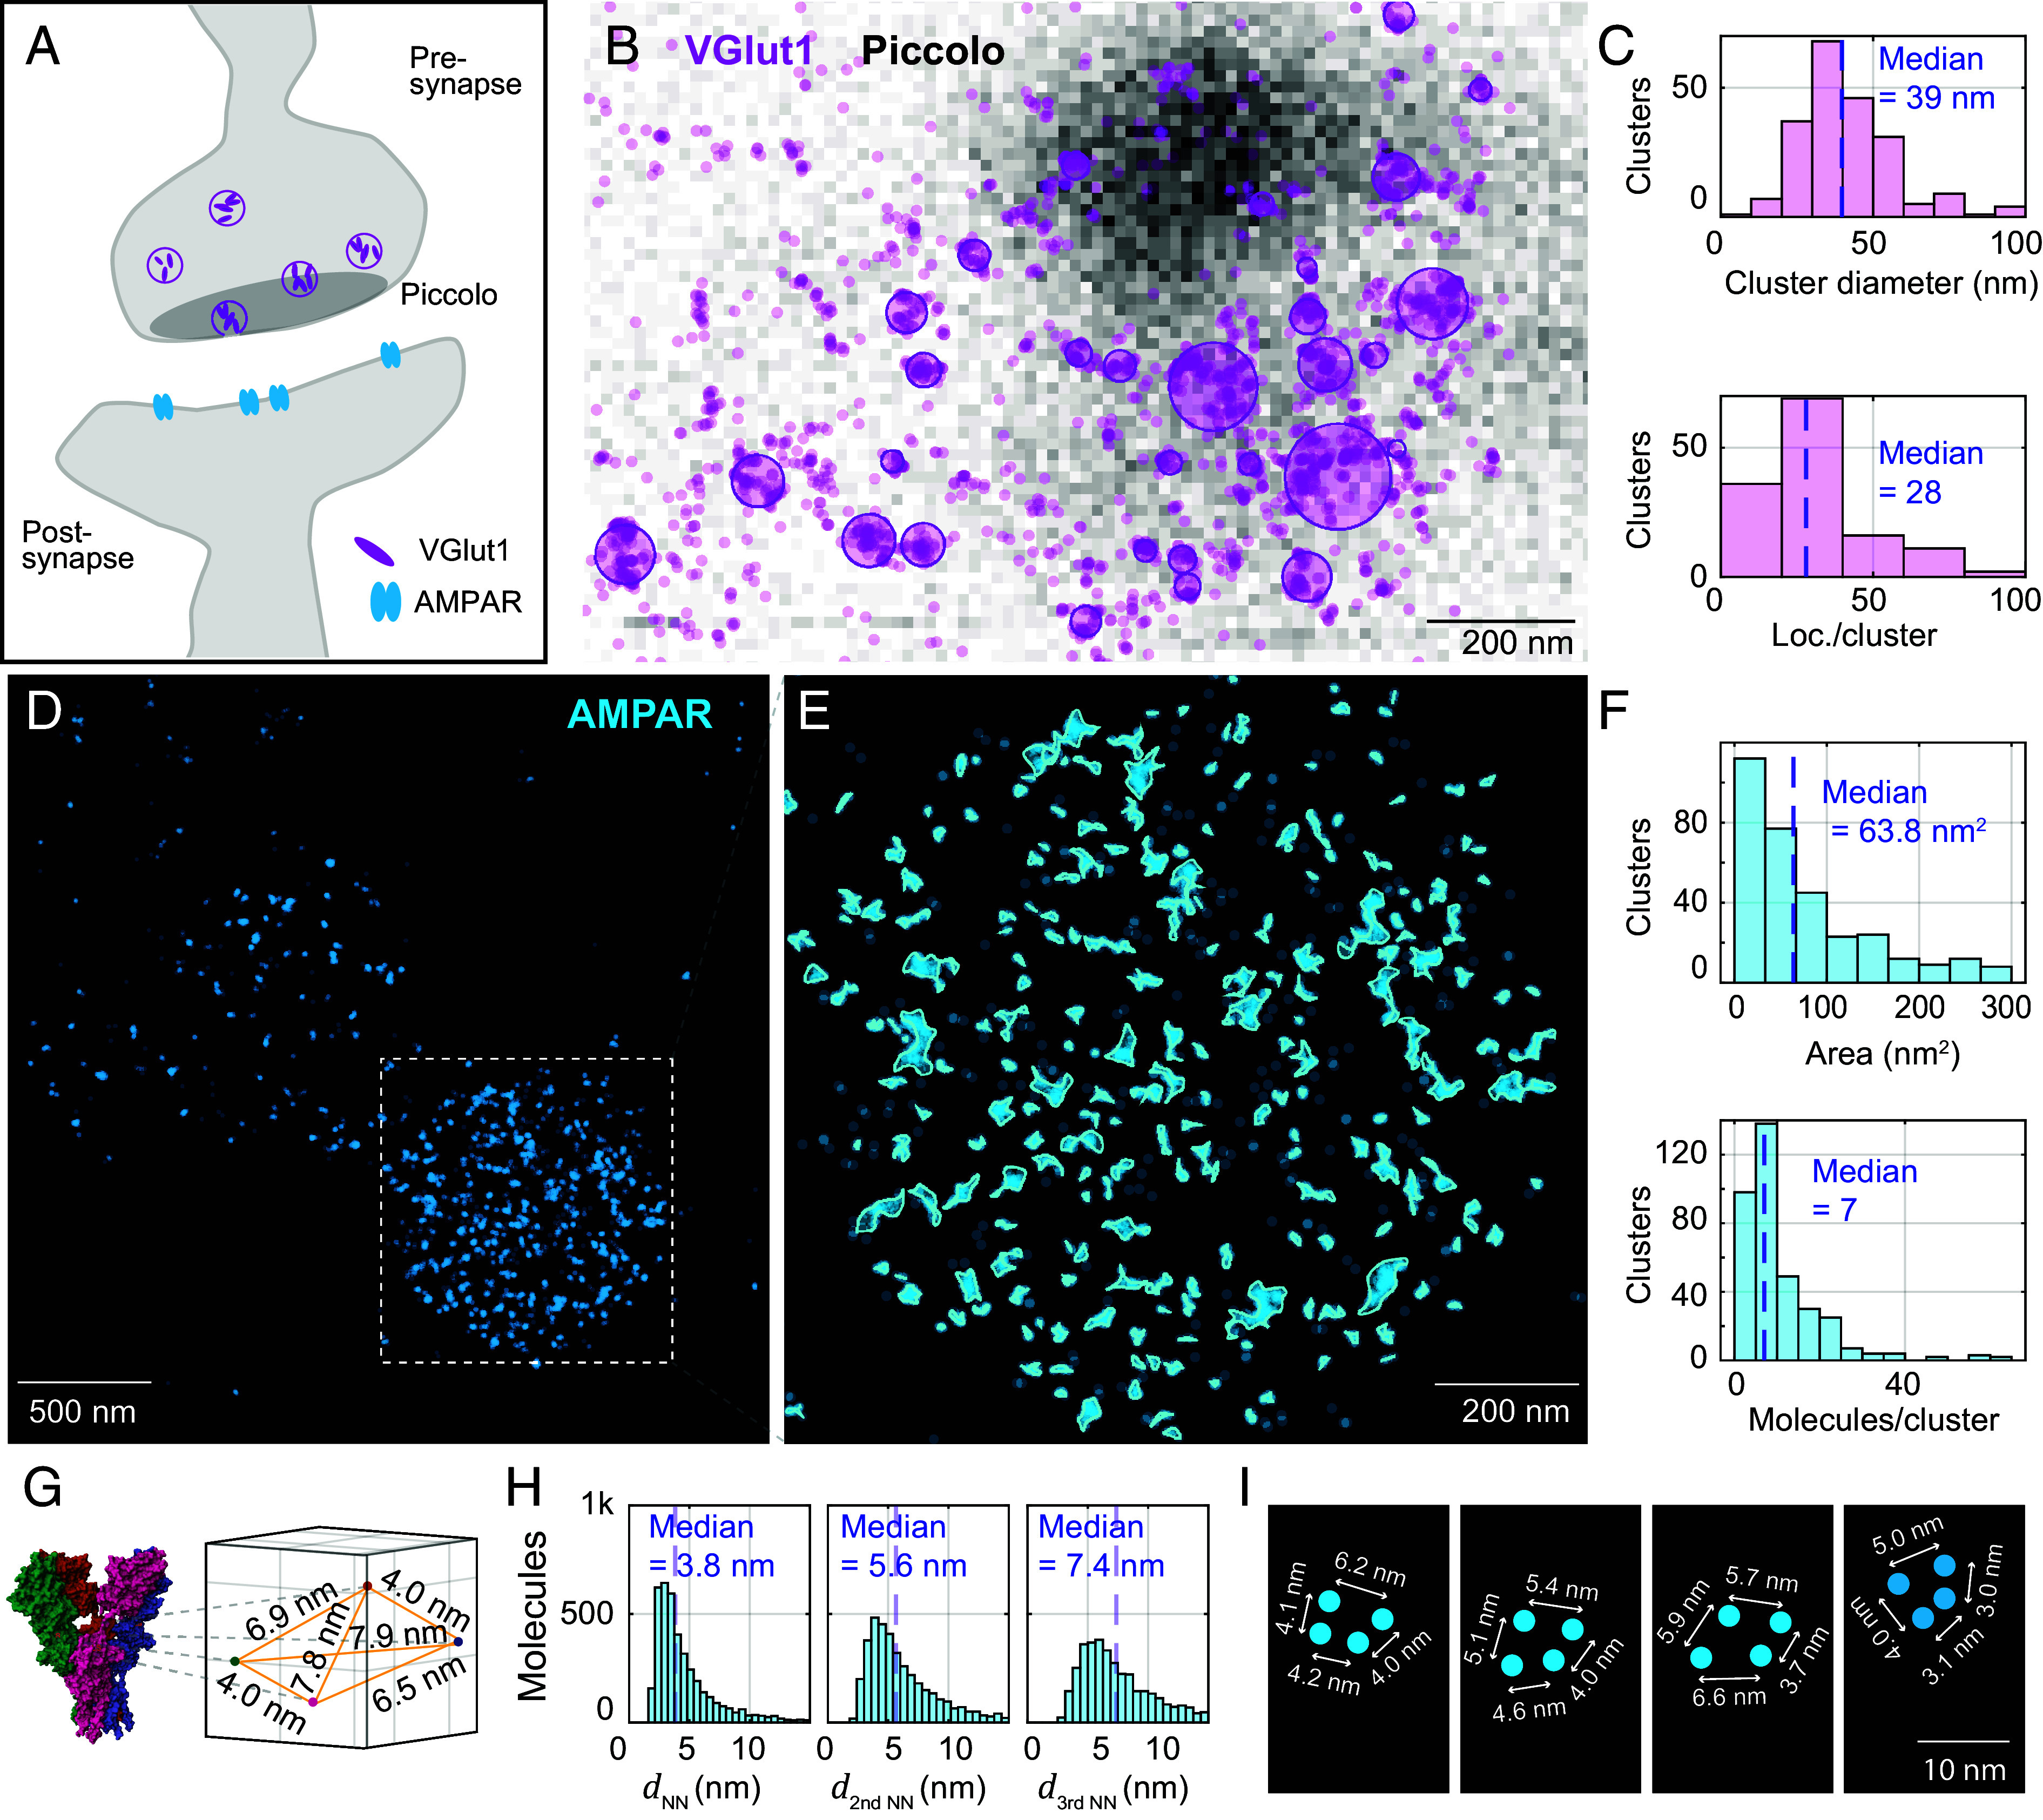
Fig. 5.

Cluster analysis of synaptic proteins in mouse brain tissue. (A) Schematic of a synapse showing the arrangement of VGlut1 in synaptic vesicles (presynapse), Piccolo situated close to the synaptic release site, and AMPA receptors (post-synapse). (B) Confocal image of Piccolo (grayscale) overlaid with MINFLUX acquisition of VGlut1 (localizations in transparent violet). VGlut1 is labeled by Alexa Fluor 647 with primary and secondary antibody. Clusters assigned by analysis with the dbscan algorithm are fitted with a circle, shown overlaid. (C) Cluster analysis of VGlut. (D) MINFLUX image reconstruction of AMPA receptors directly chemically labeled with CAM2-Alexa Fluor 647 conjugate. Localizations from the same emission event and localizations that fall within 2 nm of each other are assigned to the same molecule (AMPAR subunit). Molecules are plotted as cyan dots. (E) Zoom-in to the image region with highest molecule density, and cluster analysis of the AMPA receptors (clusters identified by dbscan and their border delineated using a spline-fit). (F) Cluster analysis of AMPAR. (G) AMPA receptor structure from PDB file 3KG2, and extracted distances between the labeled amino acids. (H) Distances dNN between AMPAR subunit localizations (nearest neighbors, second-nearest neighbors, and third-nearest neighbors). (I) Selected molecule geometries assumed to be part of completely labeled AMPA receptors.
