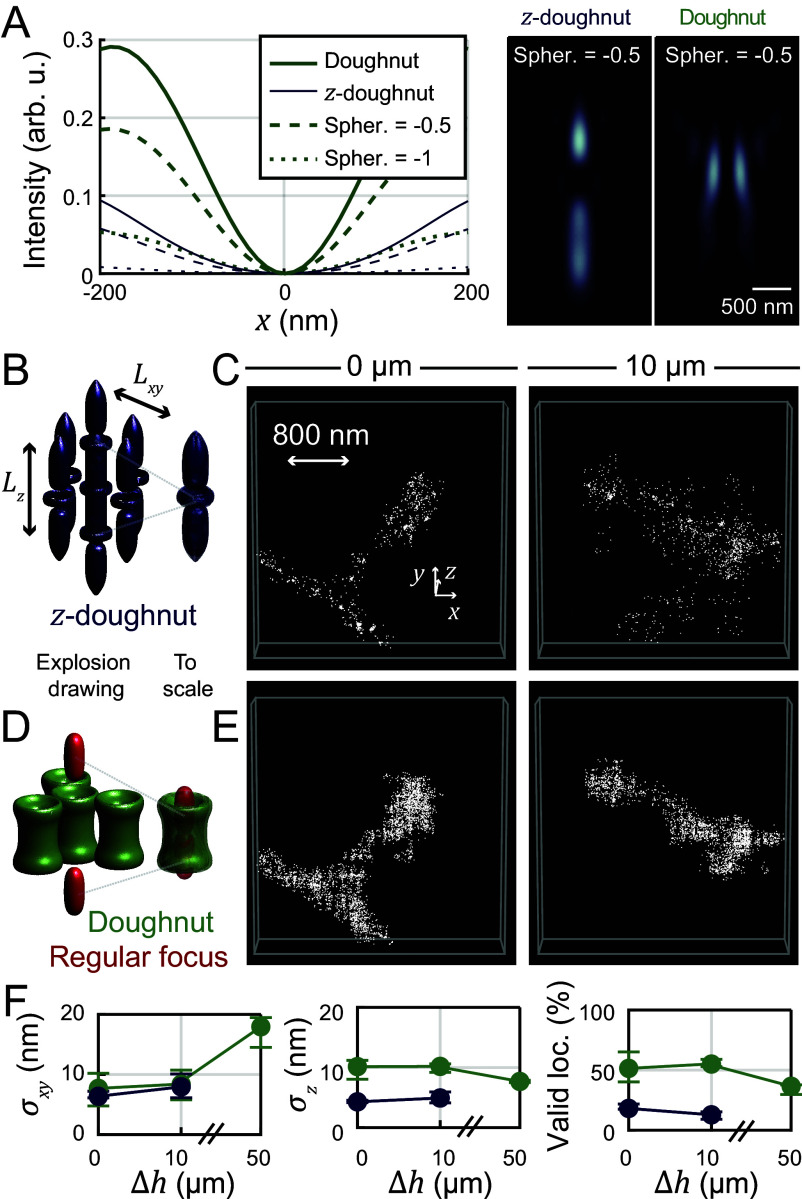
Fig. 6.
3D MINFLUX localization scheme for imaging in aberrant media. (A) Simulated focal intensity profiles for different spherical aberrations (Zernike coefficient of first-order spherical aberration; see SI Appendix, Supplementary Text). While the z-donut provides good imaging contrast along the optical axis, its contrast perpendicular to the optical axis is notably worse than for the donut, especially in the case of spherical aberrations. (B) Standard 3D MINFLUX localization scheme based on the z-donut. (C) 3D MINFLUX images of spines in 0 and 10 µm imaging depth in tissue acquired with the z-donut. (D) Donut/regularly focused beam 3D imaging scheme. (E) Same regions of interest as in (B) acquired with the donut/regular focus imaging scheme. (Interleaved acquisition: first z-donut, then donut/regular focus, then again z-donut). (F) MINFLUX metrics (color-coded) for 3D imaging with donut/regular focus or z-donut in different imaging depths.

