Fig. 7.

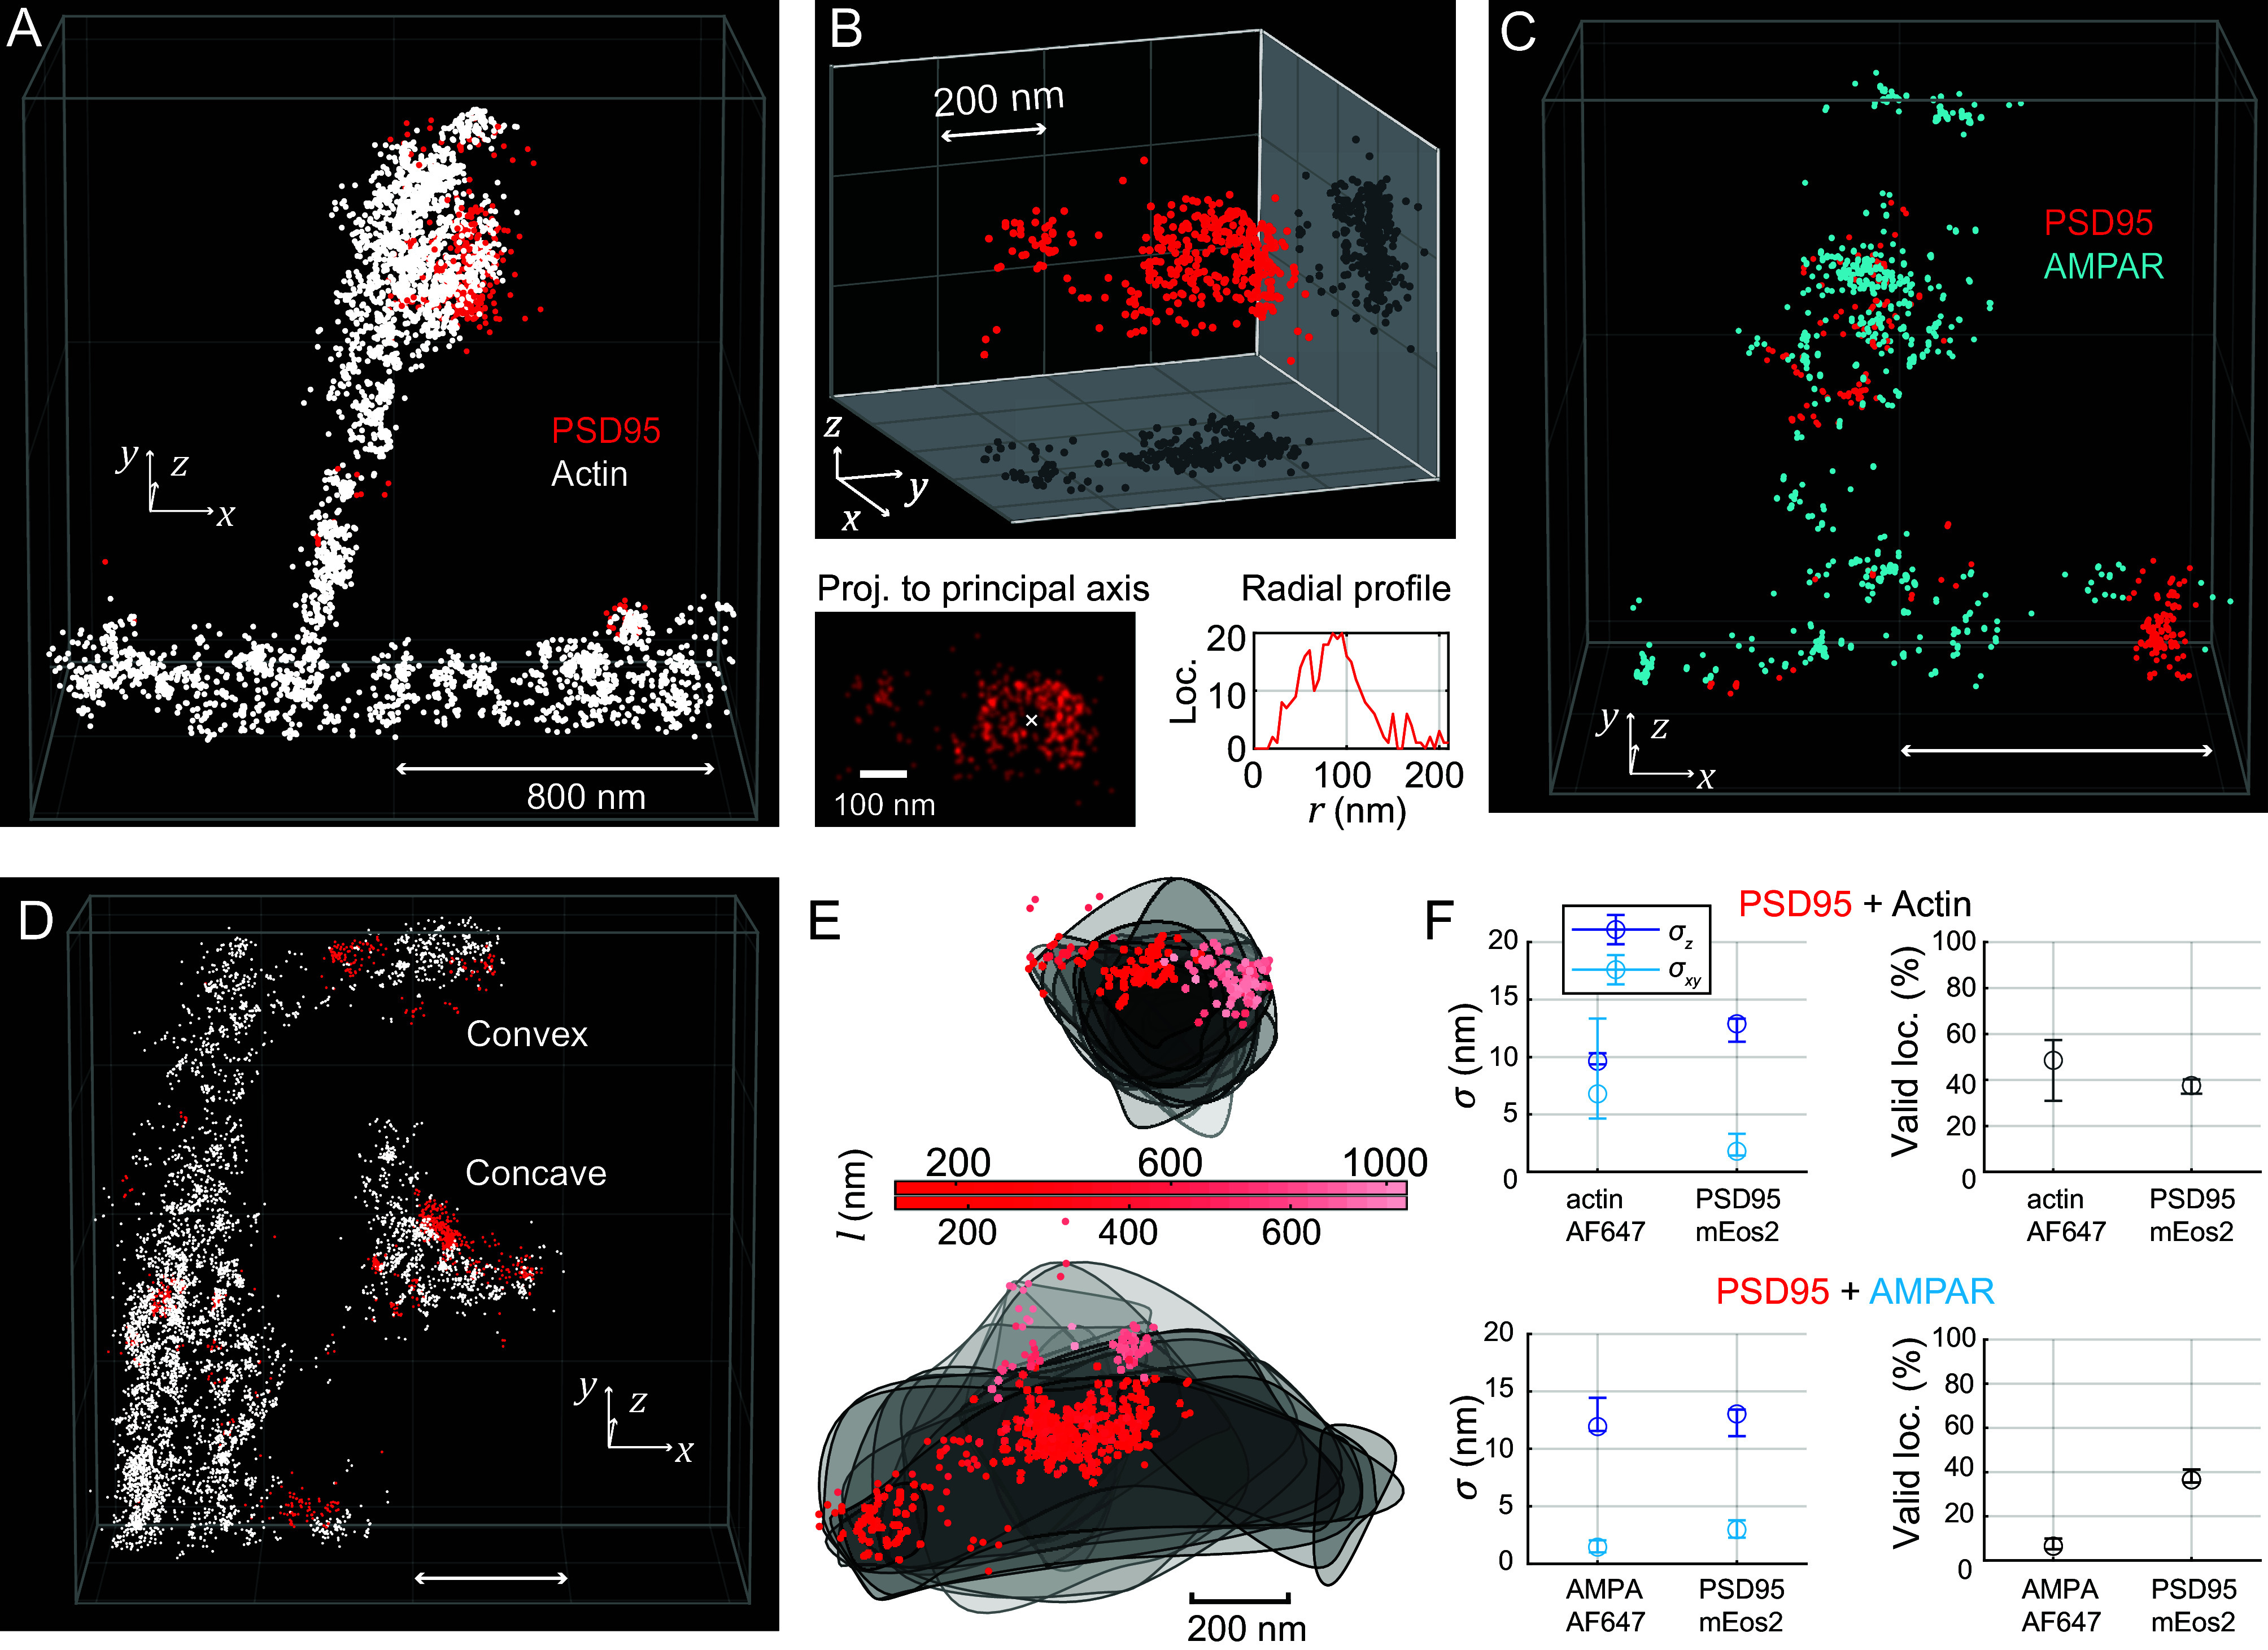
3D MINFLUX with two excitation colors for investigating the protein distributions on the post-synapse (spine head). (A) Region of interest showing part of a dendrite with a spine. Spine morphology is delineated similarly to the 2D two-color MINFLUX recording of PSD95/actin; localizations of actin in white, PSD95 in red. (B) More detailed view of the PSD95 distribution. Notably, PSD95 proteins are clustered and the biggest cluster is perforated. Projection of the localizations to an orthonormal head-on view, and radial profile centered on the hole in the cluster. (C) PSD95 and AMPA receptor (AMPAR) distribution on a spine with similar morphology. AMPA receptor localizations are plotted in blue. The highest AMPAR density is on the top of the convex spine head. (D) ROI containing two spines: one with a concave-shaped, one with a convex-shaped spine head. (E) Convex and concave spine head, shown projected from the top of the respective spine head. Gray lines delineate 80 nm thick slices of the actin dataset. PSD95 localizations shown as scatter, with the distance l along the line of sight from the top of the spine color-coded. (F) MINFLUX metrics over multiple 3D two-excitation-color MINFLUX images of actin and PSD95 as well as AMPAR and PSD95 (median values, whiskers represent interquartile range). Animations of the data in (A, C, and D) are found in Movies S1–S3. Scale bars: 800 nm or as indicated.
