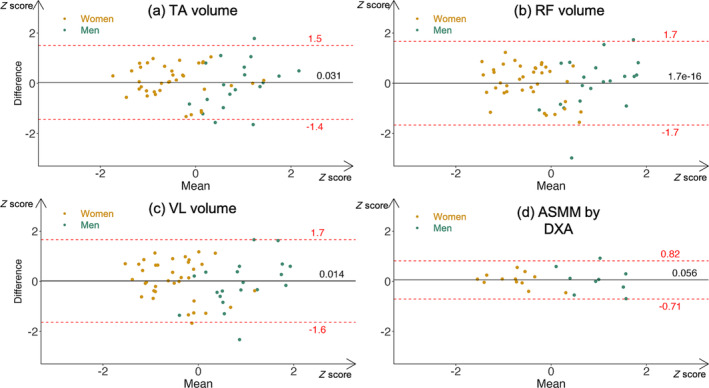
FIGURE 2.

Bland–Altman plots of BIA ASMM versus freehand 3D‐US Muscle Volumes and DXA ASMM. Variables were previously standardized with a Z‐score to allow for comparison. Women (gold) and men (green) are distinguished with colours. Black continuous lines represent mean biases. Dashed red lines represent 95% limits of agreement. To note, all Bradley–Blackwood F tests are nonsignificant, implying concordance. ASMM: appendicular skeletal muscle mass; BIA: bioelectrical impedance analysis; DXA: dual x‐ray absorptiometry; TA: tibialis anterior; RF: rectus femoris; VL: vastus lateralis.
