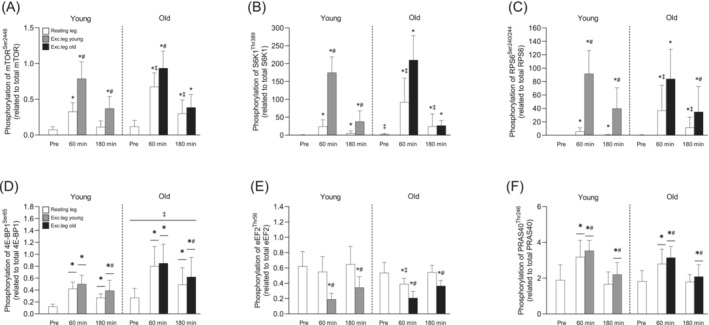
FIGURE 6.

Phosphorylation of mTOR at Ser2448 (A), S6K1 at Thr389 (B), RPS6 at Ser240/244 (C), 4E‐BP1 at Ser65 (D), eEF2 at Thr56 (E) and PRAS40 at Thr246 (F) before and after resistance exercise and intake of EAA in Young and Old. White bars represent the resting leg for both groups, whereas grey and black bars represent the exercising leg in Young and Old, respectively. A three‐way (age × time × leg) repeated‐measures ANOVA was used to analyse phosphorylation state. The ANOVA revealed a significant three‐way interaction (age × time × leg) for (A,B,C,E) and a significant two‐way interaction (time × leg) for (F,D). There was also a main effect of age for (D). The symbols marked without lines represent a three‐way interaction, symbols marked with short lines represent a two‐way interaction, and symbols marked with a long line represent a main effect; *p < 0.05 different from baseline, #p < 0.05 different from the resting leg, ‡p < 0.05 different from Young. Values are presented as means ± SD for 20 participants. For statistical analyses, data for (B), (C) and (D) were log‐transformed.
