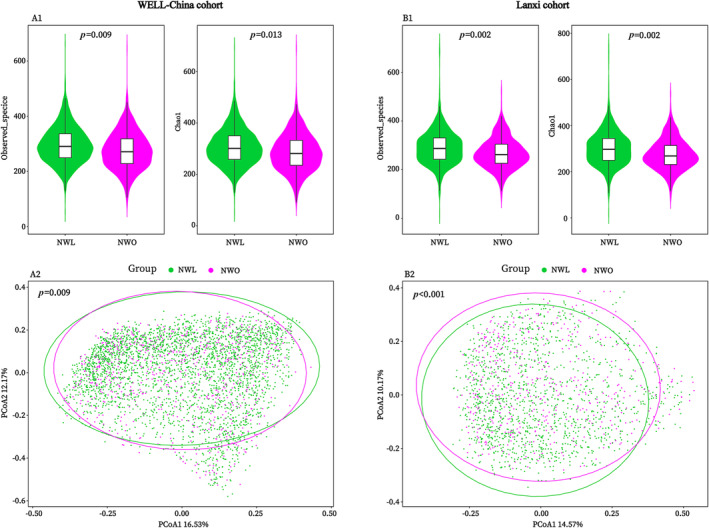
FIGURE 2.

NWO‐related gut microbial α‐ and β‐diversity alterations in the WELL‐China (A1 and A2) and Lanxi cohorts (B1 and B2). P value for α‐diversity was calculated from the multivariable linear regression model, and adjusted for potential confounding factors (described in the text). Permutational ANOVA (999 permutations) was used to evaluate the P value for β‐diversity. NWL, normal weight lean; NWO, normal weight obesity.
